


Gold Technical Price Outlook: XAU/USD Near-term Trade Levels
- Gold price updated technical trade levels – Daily & Intraday Charts
- XAU/USD June opening-range preserved just above key support- breakout levels
- New to Gold Trading? Get started with this Free How to Trade Gold -Beginners Guide
Gold prices virtually unchanged for the month despite a range of nearly 4% with XAU/USD holding just above a key technical support barrier we’ve been tracking for weeks now. The focus falls on a breakout of this key range heading into the close of the month with the broader downtrend still in play while below the June highs. These are the updated targets and invalidation levels that matter on the XAU/USD technical charts this week. Review my latest Strategy Webinar for an in-depth breakdown of this gold technical setup and more.
Gold Price Chart - XAU/USD Daily

Chart Prepared by Michael Boutros, Technical Strategist; Gold on Tradingview
Technical Outlook: In my last Gold Price Outlook we warned to be on the lookout for a break of the monthly range while highlighting that, “rallies should be capped by the 200-day moving average (currently ~1843) IF price is indeed heading lower. Ultimately, we’re on the lookout for a medium-term exhaustion low in the days ahead.” Gold briefly dipped below the June opening-range lows before quickly recovering with the rally registering a high last week at 1857 before closing back below the 200-day moving average. The move leaves gold prices nearly unchanged for the month and the focus remains on a breakout of the 1818-1877 range for further guidance on our medium-term directional bias.
Gold Price Chart - XAU/USD 240min
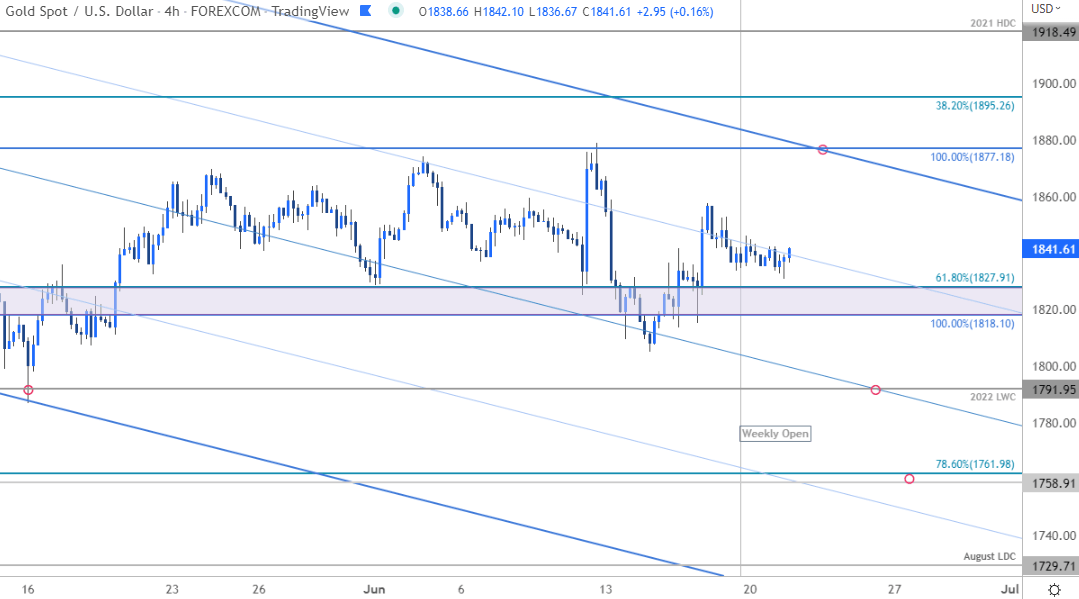
Notes: A closer look at Gold price action shows XAU/USD rebounding off the median-line last week before pivoting back above the 1818/27support zone. Initial resistance now at Friday’s high at 1857 backed by the upper parallel / 100% ext of the late-2021 advance at 1877- a breach / close above this threshold is needed to suggest a more significant reversal is underway towards the 38.2% Fibonacci retracement of the March decline at 1895 and the 2021 high-day close at 1918. A break / close below this 1818 keeps the focus on subsequent support objectives at the 2022 low-week close at 1791 and the November lows / 78.6% retracement at 1758/61- look for a larger reaction there IF reached.

Bottom line: Gold prices continue to preserve the June range just above technical support at 1818/27. From a trading standpoint, last week’s outside reversal candle does put a bearish tone on XAU/USD but a break / close below this threshold is still needed to mark resumption of the broader downtrend. Ultimately, the outlook remains unchanged and we’re looking for evidence of a near-term exhaustion low into the close of the month. Stay tuned! Review my latest Gold Weekly Price Outlook for a closer look at the longer-term XAU/USD technical trading levels.
For a complete breakdown of Michael’s trading strategy, review his Foundations of Technical Analysis series on Building a Trading Strategy
Gold Trader Sentiment – XAU/USD Price Chart

- A summary of IG Client Sentiment shows traders are net-long Gold- the ratio stands at +4.16 (80.62% of traders are long) – typically bearishreading
- Long positions are2.30% higher than yesterday and 7.29% lower from last week
- Short positions are10.10% higher than yesterday and 29.18% higher from last week
- We typically take a contrarian view to crowd sentiment, and the fact traders are net-long suggests Gold prices may continue to fall. Yet traders are less net-long than yesterday and compared with last week. Recent changes in sentiment warn that the current Gold price trend may soon reverse higher despite the fact traders remain net-long.
| Change in | Longs | Shorts | OI |
| Daily | 1% | -3% | -1% |
| Weekly | 2% | -8% | -2% |
Economic Calendar

Economic Calendar - latest economic developments and upcoming event risk.
Active Technical Setups
- Crude Oil Price Technical Outlook: WTI Rally Stalls- Pullback Levels
- EUR/USD Technical Outlook: Euro Coils into ECB- Breakout Potential
- Australian Dollar Technical Outlook: AUD/USD Threatens Breakout at Yearly Open
- Written by Michael Boutros, Technical Strategist with DailyFX
Follow Michael on Twitter @MBForex


