


Gold Technical Price Outlook: XAU/USD Near-term Trade Levels
- Gold price updated technical trade levels – Daily & Intraday Charts
- XAU/USD threatens break below support / June opening-range ahead of FOMC
- New to Gold Trading? Get started with this Free How to Trade Gold -Beginners Guide
Gold prices are attempting to break below a key support barrier and the monthly range lows ahead of tomorrow highly anticipated FOMC interest rate decision. Expectations for a steeper path of Fed rate-hikes have continued to weigh on the yellow metal with XAU/USD breaking to fresh monthly lows today. These are the updated targets and invalidation levels that matter on the XAU/USD technical charts heading into FOMC. Review my latest Strategy Webinar for an in-depth breakdown of this gold technical setup and more.
Gold Price Chart - XAU/USD Daily

Chart Prepared by Michael Boutros, Technical Strategist; Gold on Tradingview
Technical Outlook: In my last Gold Price Outlook we highlighted that XAU/USD had carved, “the June opening-range just above key support at 1818/27- a region defined by the 100% extension of the yearly decline and the 61.8% Fibonacci retracement of the 2021 advance. Look for the breakout in the days ahead to offer further guidance on our medium-term directional bias.” Massive back-to-back outside-day reversal patterns reinforced this key rang with gold attempting to break key support today- we’re looking for a daily close below to validate the move.
Gold Price Chart - XAU/USD 240min
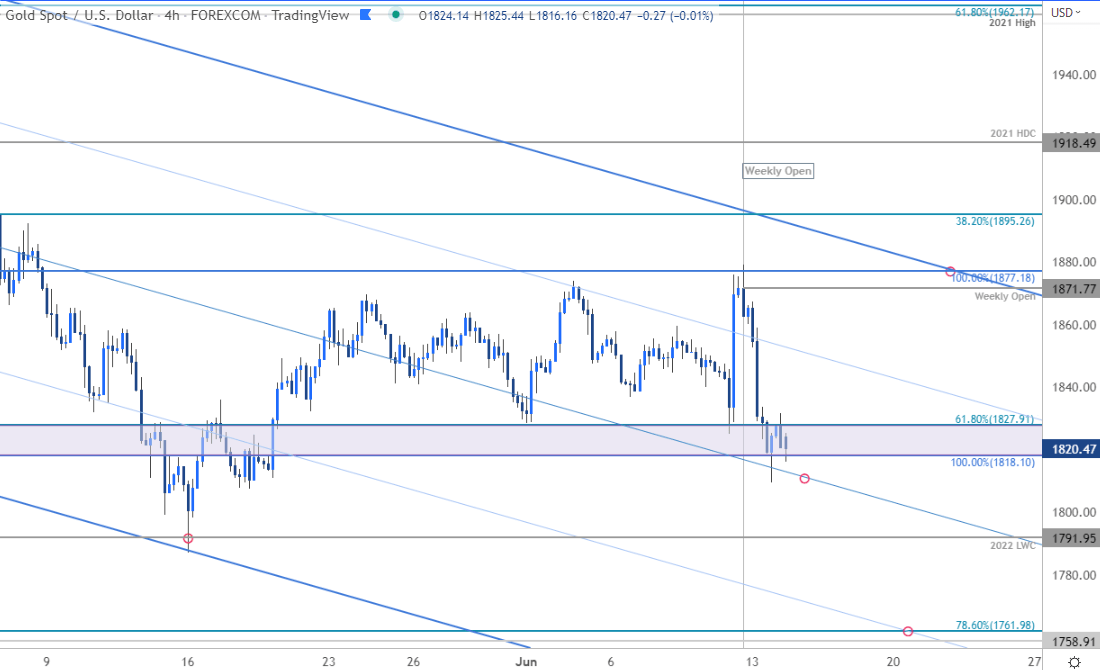
Notes: A closer look at Gold price action shows XAU/USD slipping into the 1818/27 support zone in early US trade with the median-line resting just lower. A close below this threshold would threaten resumption of the broader downtrend towards subsequent support objectives at the yearly low-week close at 1791 and November lows / 78.6% retracement at 1758/61- look for a larger reaction there IF reached. Weekly-open resistance stands at 1871 with near-term bearish invalidation now lowered to the upper parallel near ~1880.

Bottom line: A break below the monthly opening-range here would keep the bearish trend in play towards the yearly lows – watch the daily closes. From a trading standpoint, look to reduce short-positioning / lower protective stops on a stretch towards 1760- rallies should be capped by the 200-day moving average (currently ~1843) IF price is indeed heading lower. Ultimately, we’re on the lookout for a medium-term exhaustion low in the days ahead. Stay nimble heading into tomorrow’s FOMC interest rate decision - expect volatility. Review my latest Gold Weekly Price Outlook for a closer look at the longer-term XAU/USD technical trading levels.
For a complete breakdown of Michael’s trading strategy, review his Foundations of Technical Analysis series on Building a Trading Strategy
Gold Trader Sentiment – XAU/USD Price Chart

- A summary of IG Client Sentiment shows traders are net-long Gold- the ratio stands at +5.80 (85.29% of traders are long) – typically bearishreading
- Long positions are0.34% lower than yesterday and 3.84% higher from last week
- Short positions are17.23% lower than yesterday and 17.91% lower from last week
- We typically take a contrarian view to crowd sentiment, and the fact traders are net-long suggests Gold prices may continue to fall. Traders are further net-long than yesterday and last week, and the combination of current positioning and recent changes gives us a stronger Gold-bearish contrarian trading bias from a sentiment standpoint.
| Change in | Longs | Shorts | OI |
| Daily | -3% | -1% | -2% |
| Weekly | 10% | -14% | -4% |
Economic Calendar
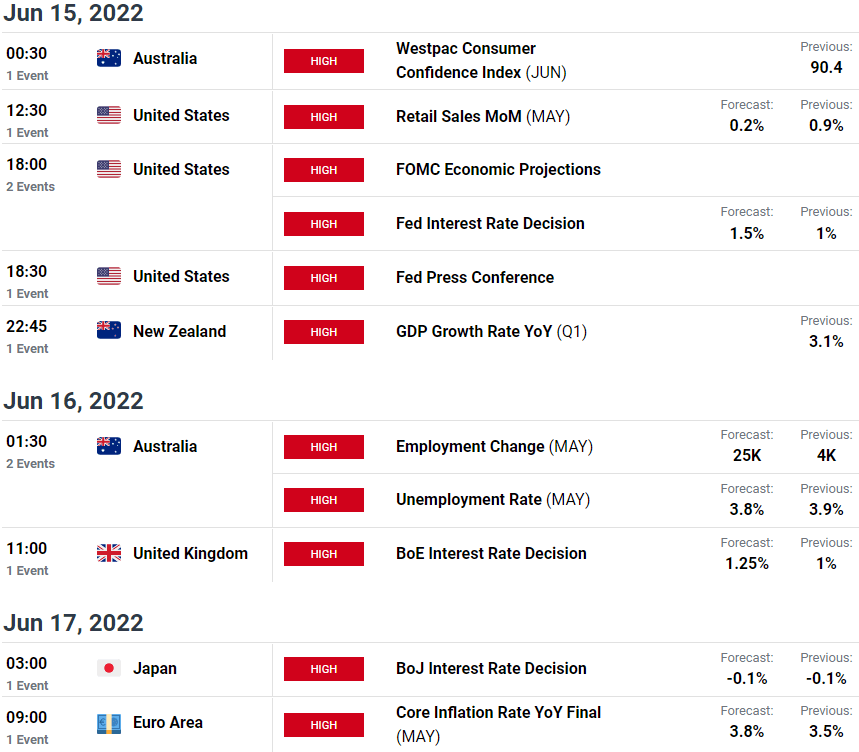
Economic Calendar - latest economic developments and upcoming event risk.
Active Technical Setups
- EUR/USD Technical Outlook: Euro Coils into ECB- Breakout Potential
- Australian Dollar Technical Outlook: AUD/USD Threatens Breakout at Yearly Open
- EUR/AUD Technical Outlook: Five-Day Breakdown Testing Initial Support
- Canadian Dollar Technical Outlook: USD/CAD Plunges into Pivotal Range
- Written by Michael Boutros, Technical Strategist with DailyFX
Follow Michael on Twitter @MBForex


