


Gold Technical Price Outlook: XAU/USD Weekly Trade Levels
- Gold price updated technical trade levels - Weekly Chart
- XAU/USD plummets into key technical support- rebound up more than 2.8%- is a low in?
- New to Gold Trading? Get started with this Free How to Trade Gold -Beginners Guide
Gold prices plummeted more than 4.6% into the open of trade this week with XAU/USD responding to key technical support at the yearly lows. Price has already rallied more than 2.8% off the lows – is a low in place? These are the updated targets and invalidation levels that matter on the XAU/USD weekly technical chart. Review my latest Weekly Strategy Webinar for an in-depth breakdown of this gold technical setup and more.
Gold Price Chart - XAU/USD Weekly
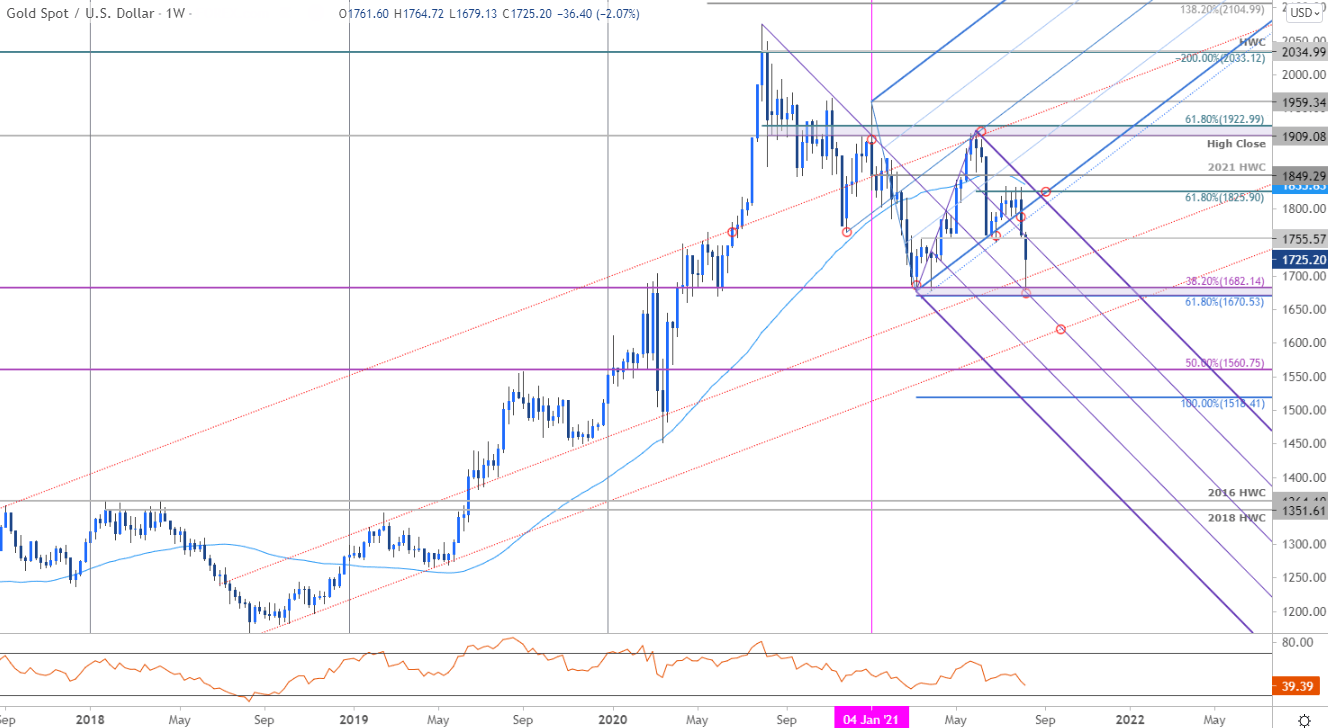
Chart Prepared by Michael Boutros, Technical Strategist; Gold on Tradingview
Notes: In last month’s Gold Weekly PriceOutlook we noted that, “A three-week rebound off uptrend support in Gold has already covered 38.2% of the June decline and while the recent stretch could ease in the days ahead, we’re on the lookout for a possible exhaustion high later in the month.” XAU/USD continued to struggle into 1830 for the following four-weeks before collapsing last week with the breakdown breaking below the ascending pitchfork formation we’ve been tracking off the yearly low. The decline took a leg lower into the open this week before rebounding off critical technical support at the 1670/82 support confluence- a region defined by the 61.8% extension of the 2020 decline, the objective yearly opening-range low and the 38.2% retracement of the 2015 advance. We’re looking for guidance off this mark with the bears vulnerable while above.
A proposed descending formation off the 2021 high may be in play here but it’s too early to rely on. That said, look for weekly resistance at 1755 with broader bearish invalidation now lowered to the 61.8% Fibonacci retracement of the June decline / 2021 high-week close at 1825/49. A break below this key support zone would likely fuel another bout of accelerated losses for bullion with such a scenario exposing subsequent weekly support objectives at the highlighted trendline confluence near 1620s backed by the 50% retracement at 1560.

Bottom line: The gold price collapse has responded to a critical technical support zone at the objective yearly lows- looking for the inflection off this zone to offer guidance. From at trading standpoint, the battle lines are clear and the immediate focus is on possible inflection here with the bulls vulnerable while above 1670- be on the lookout for possible topside exhaustion into the upper parallel IF price is heading lower with a weekly close lower needed to threaten a larger correction in price. Ultimately, a weekly close above 1849 is needed to mark resumption of the Gold broader uptrend. I’ll publish an updated Gold Price Outlook once we get a further clarity on the near-term XAU/USD technical trade levels.
For a complete breakdown of Michael’s trading strategy, review his Foundations of Technical Analysis series on Building a Trading Strategy
Gold Trader Sentiment – XAU/USD Price Chart
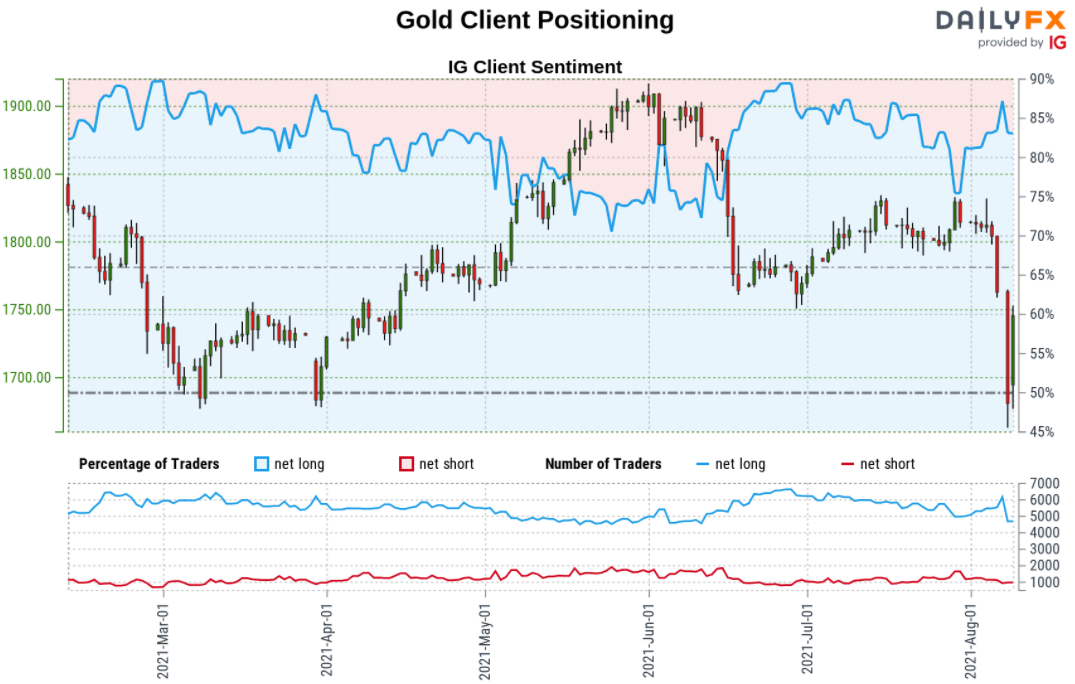
- A summary of IG Client Sentiment shows traders are net-long Gold- the ratio stands at +2.79 (73.59% of traders are long) – typically bearishreading
- Long positions are0.53% lower than yesterday and 6.21% lower from last week
- Short positions are86.85% higher than yesterday and 44.98% higher from last week
- We typically take a contrarian view to crowd sentiment, and the fact traders are net-long suggests Gold prices may continue to fall. Yet traders are less net-long than yesterday and compared with last week. Recent changes in sentiment warn that the current Gold price trend may soon reverse higher despite the fact traders remain net-long.
| Change in | Longs | Shorts | OI |
| Daily | 1% | -3% | -1% |
| Weekly | 2% | -8% | -2% |
---
Previous Weekly Technical Charts
- US Dollar Index (DXY)
- Australian Dollar (AUD/USD)
- New Zealand Dollar (NZD/USD)
- Canadian Dollar (USD/CAD)
- Sterling (GBP/USD)
- Euro (EUR/USD)
- Japanese Yen (USD/JPY)
- Written by Michael Boutros, Currency Strategist with DailyFX
Follow Michael on Twitter @MBForex


