


Gold Technical Price Outlook: XAU/USD Weekly Trade Levels
- Gold price updated technical trade levels - Weekly Chart
- XAU/USD rebound off uptrend support marks third consecutive weekly advance- correction?
- New to Gold Trading? Get started with this Free How to Trade Gold -Beginners Guide
Gold prices rallied for a third consecutive week with XAU/USD up more than 0.8% into the close on Friday. Gold has now surged nearly 3.9% off the June low and while a rebound off uptrend support keeps the medium-term outlook constructive, we are on the lookout for exhaustion on a stretch higher in the weeks ahead.These are the updated targets and invalidation levels that matter on the XAU/USD weekly technical chart. Review my latest Weekly Strategy Webinar for an in-depth breakdown of this gold technical setup and more.
Gold Price Chart - XAU/USD Weekly
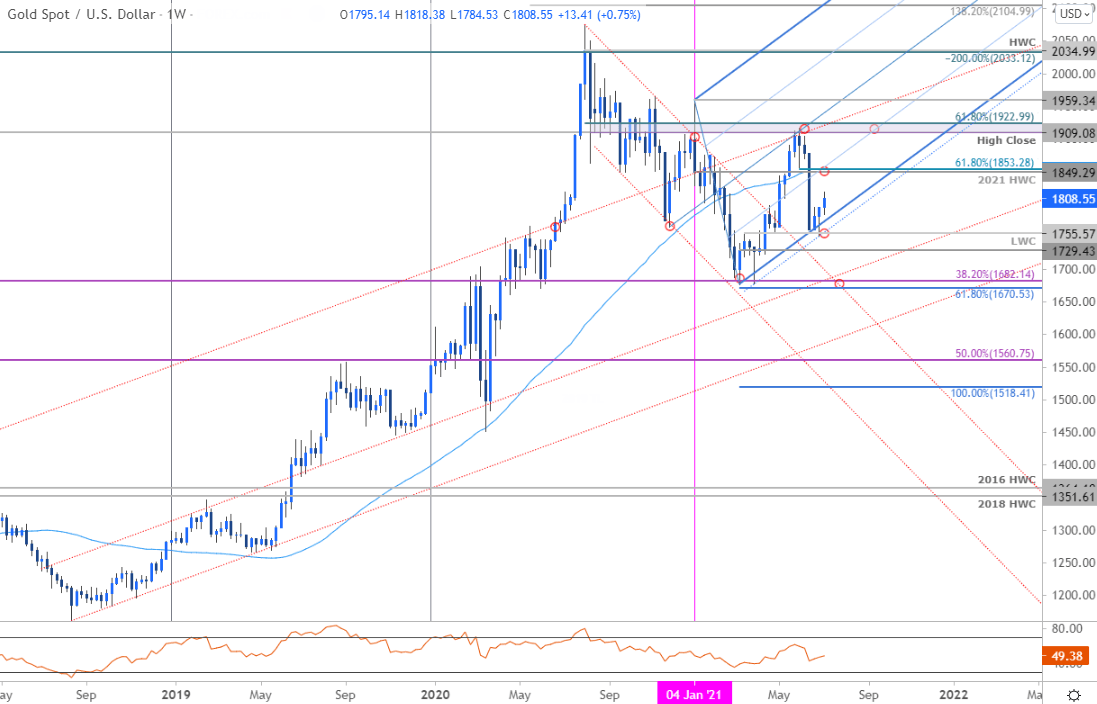
Chart Prepared by Michael Boutros, Technical Strategist; Gold on Tradingview
Notes: In last month’s Gold Weekly PriceOutlook we noted that XAU/USD had plunged into, “key uptrend support targets into the June close – we’re on the lookout for an exhaustion low heading into July.” That week ended up being the low with gold rallying more than 3.8% into the monthly open. So is low in place at uptrend?
The bulls aren’t out of the woods just yet- as highlighted in this week Gold Price Outlook, the daily wave-pattern suggests this rebound may be corrective. If so, a pullback here may yet still give way to a larger rebound. Key weekly support rest with the sliding parallel extending off the yearly lows / March high at 1755 with weekly resistance eyed at the confluence of the 2021 high-week close, the 61.8% Fibonacci retracement of the June decline and 52-week moving average at 1849/53- look for topside exhaustion ahead of this threshold IF price is still heading lower.
A break / close below pitchfork support would likely fuel an accelerated bout of selling with such a scenario exposing the yearly low-week close at 1729 and critical support at the confluence of the 38.2% retracement of the late-2015 advance and the 61.8% extension of 2020 decline at 1670/82- an area of interest for possible downside exhaustion IF reached.

Bottom line: A three-week rebound off uptrend support in Gold has already covered 38.2% of the June decline and while the recent stretch could ease in the days ahead, we’re on the lookout for a possible exhaustion high later in the month. From a trading standpoint, the recovery should be capped by 1853IF this recent rally is indeed corrective- look for a reaction there for guidance with a close below 1755 needed to mark resumption of the June decline. Review my latest Gold Price Outlook for a closer look at the near-term XAU/USD technical trade levels.
For a complete breakdown of Michael’s trading strategy, review his Foundations of Technical Analysis series on Building a Trading Strategy
Gold Trader Sentiment – XAU/USD Price Chart
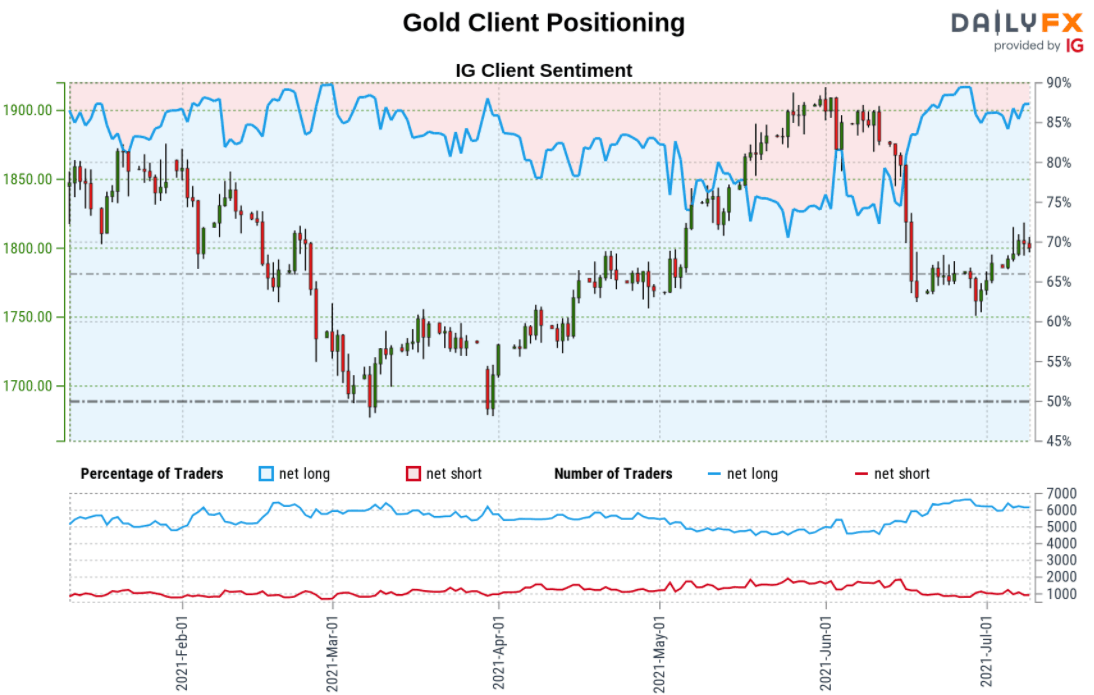
- A summary of IG Client Sentiment shows traders are net-long Gold- the ratio stands at +6.02 (85.75% of traders are long) – typically bearishreading
- Long positions are2.05% higher than yesterday and 0.94% lower from last week
- Short positions are14.15% lower than yesterday and 9.98% lower from last week
- We typically take a contrarian view to crowd sentiment, and the fact traders are net-long suggests Gold prices may continue to fall. Traders are further net-long than yesterday and last week, and the combination of current positioning and recent changes gives us a stronger Gold-bearish contrarian trading bias from a sentiment standpoint.
| Change in | Longs | Shorts | OI |
| Daily | 1% | -3% | -1% |
| Weekly | 2% | -8% | -2% |
---
Previous Weekly Technical Charts
- Crude Oil (WTI)
- New Zealand Dollar (NZD/USD)
- Japanese Yen (USD/JPY)
- Sterling (GBP/USD)
- Australian Dollar (AUD/USD)
- Canadian Dollar (USD/CAD)
- Euro (EUR/USD)
- US Dollar Index (DXY)
- Written by Michael Boutros, Currency Strategist with DailyFX
Follow Michael on Twitter @MBForex


