


New Zealand Dollar Technical Price Outlook: NZD/USD Weekly Trade Levels
- New Zealand Dollar updated technical trade levels - Weekly Chart
- NZD/USD plunge pauses at confluent uptrend support- FOMC on tap
- Key support 6941/69 – Resistance 7100, 7150/89 critical
The New Zealand Dollar is fractionally higher against the US Dollar into the start of the week with NZD/USD testing a key technical support pivot for over a month now. We’re looking for clarity this week with Federal Reserve interest rate decision on Wednesday likely to offer some guidance as Kiwi ranges into a multi-month uptrend. These are the updated targets and invalidation levels that matter on the NZD/USD weekly price chart heading into FOMC. Review my latest Strategy Webinar for an in-depth breakdown of this Kiwitrade setup and more.
New Zealand Dollar Price Chart – NZD/USD Weekly
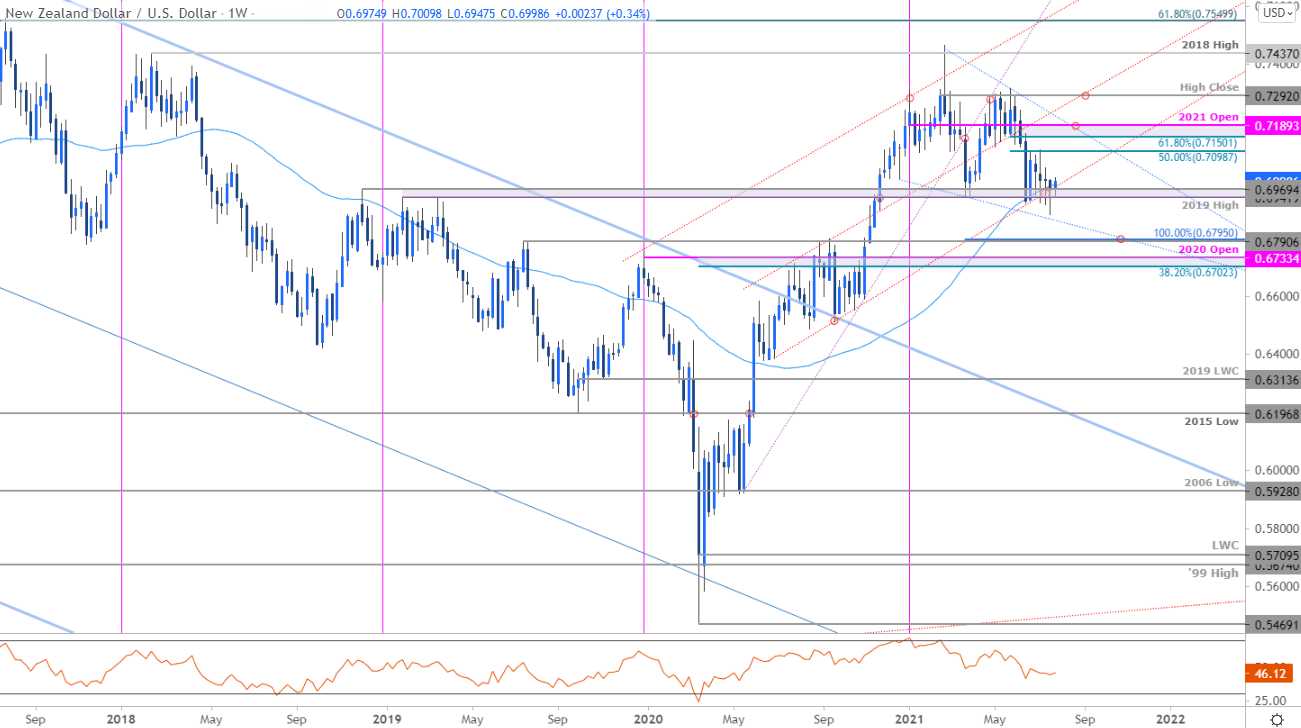
Chart Prepared by Michael Boutros, Technical Strategist; NZD/USD on Tradingview
Notes: In my last New Zealand Dollar Price Forecast we noted that Kiwi had, “plunged into confluence uptrend support and we’re looking for possible inflection off this zone.” NZD/USD is poised to mark a sixth weekly test of key support at the 2019 / December 2018 highs at 6941/69 and despite multiple intraweek stretches into fresh yearly lows, the bears remain vulnerable while above level.
Initial weekly resistance stands at 7100 with critical resistance eye at the 61.8% Fibonacci retracement of the May decline / objective 2021 yearly open at 7150/89- look for a reaction there IF reached with a close above needed to keep the focus on the objective yearly high-close at 7292. A weekly close below this key support zone would expose the July 2019 high / 100% extension of the yearly decline at 6790/95 backed by the 38.2% retracement of the 2020 advance / the 2020 yearly open at 6702/33.

Bottom line: The New-Zealand Dollar has continued to hold above key technical uptrend support for over a month now. From a trading standpoint, a good zone to reduce short-exposure / lower protective stops– the risk remains for some recovery here but be on the lookout for possible topside exhaustion ahead of the yearly open IF price is indeed heading lower. Stay nimble heading into the FOMC interest rate decision this week with the event likely to fuel increased volatility in the USD crosses. Review my latest New Zealand Dollar Price Outlook for a closer look at the near-term Kiwi technical trade levels.
For a complete breakdown of Michael’s trading strategy, review his Foundations of Technical Analysis series on Building a Trading Strategy
New Zealand Dollar Trader Sentiment – NZD/USD Price Chart

- A summary of IG Client Sentiment shows traders are net-short NZD/USD - the ratio stands at -1.22 (45.03% of traders are long) – typically weak bullish reading
- Long positions are 2.67% higher than yesterday and 9.68% lower from last week
- Short positions are 4.16% higher than yesterday and 16.77% higher from last week
- We typically take a contrarian view to crowd sentiment, and the fact traders are net-short suggests NZD/USD prices may continue to rise. Traders are further net-short than yesterday and last week, and the combination of current positioning and recent changes gives us a stronger NZD/USD-bullish contrarian trading bias from a sentiment standpoint.
Key New Zealand / US Economic Releases
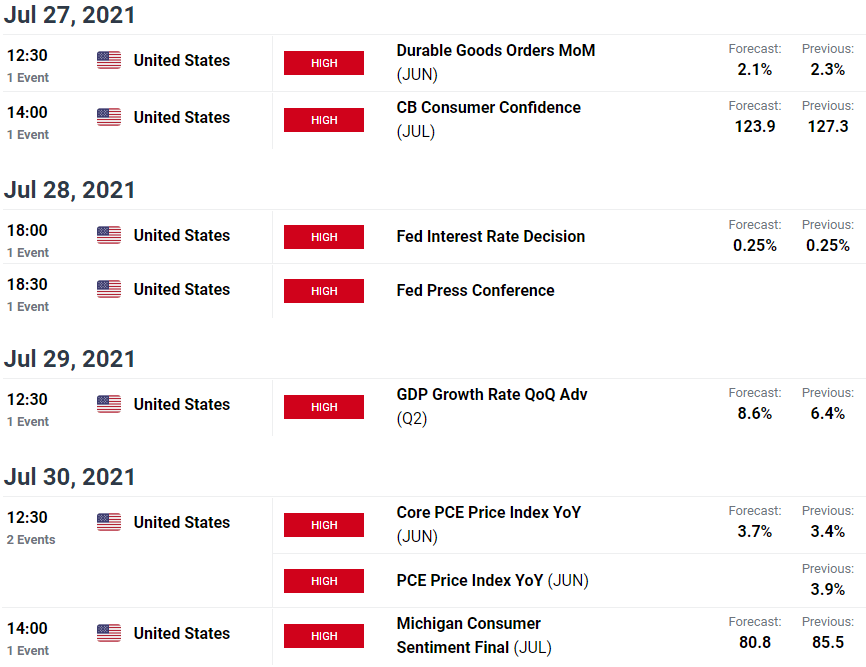
Economic Calendar - latest economic developments and upcoming event risk.
Previous Weekly Technical Charts
- Canadian Dollar (USD/CAD)
- Australian Dollar (AUD/USD)
- Crude Oil (WTI)
- Sterling (GBP/USD)
- Euro (EUR/USD)
- US Dollar Index (DXY)
- Gold (XAU/USD)
- Japanese Yen (USD/JPY)
--- Written by Michael Boutros, Technical Currency Strategist with DailyFX
Follow Michael on Twitter @MBForex


