


Canadian Dollar Technical Price Outlook: USD/CAD Weekly Trade Levels
- Canadian Dollar updated technical trade levels - Weekly Chart
- USD/CAD rally exhausts into technical resistance- risk for correction within broader uptrend
- Critical support 1.2313- Key resistance 1.2774
The Canadian Dollar is poised to snap a three- week losing streak against the US Dollar with USD/CAD down more than 0.2% to trade at 1.2580 ahead of the New York close on Friday. The losses come on the back of a major reversal off technical resistance and while the broader outlook remains constructive, the advance may be vulnerable heading into the close of the month. These are the updated targets and invalidation levels that matter on the USD/CAD weekly technical price charts. Review my latest Strategy Webinar for an in-depth breakdown of this Loonie technical setup and more.
Canadian Dollar Price Chart – USD/CAD Weekly
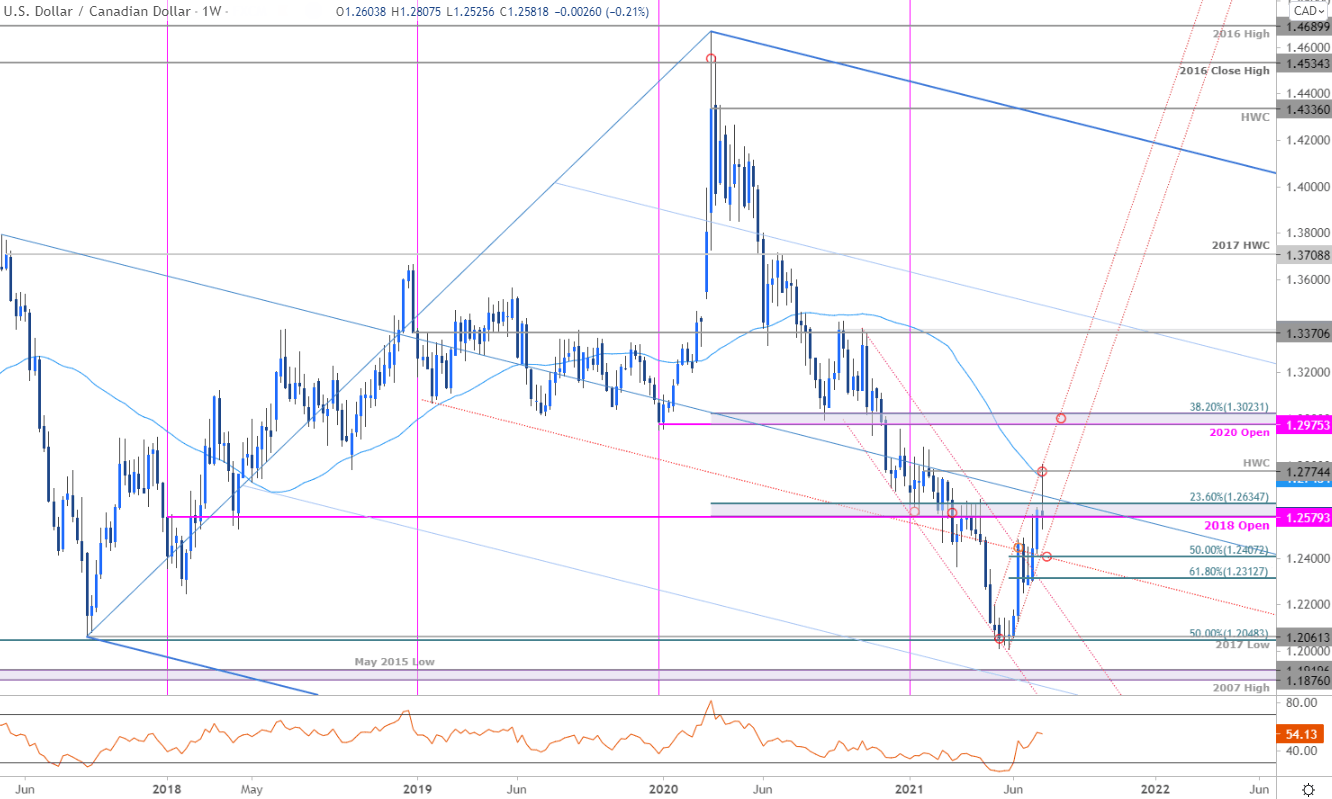
Chart Prepared by Michael Boutros, Technical Strategist; USD/CAD on Tradingview
Notes:In my last Canadian Dollar Weekly Price Outlook we noted that the USD/CAD breakout had extended into a, “key technical resistance range at 1.2579-1.2634- a region defined by the 2018 objective yearly open and the 23.6% Fibonacci retracement of the 2020 decline. We’re on the lookout for possible price inflection off this threshold….A topside breach / close above the median-line (blue) / yearly open at 1.2713 would be needed to mark resumption with such a scenario exposing 52-week moving average / 2021 high-week close at 1.2762/74 and the yearly highs at 1.2881.” Price briefly registered and intraweek high at 1.2807 before reversing sharply with Loonie poised to close the week back within the 1.2579-1.2634 resistance zone. Was that a near-term exhaustion high?
The immediate focus heading into the start of the week will be on possible topside exhaustion while below this resistance threshold. Initial weekly support rests with the May trendline backed closely by the 1.24-handle and the 61.8% retracement at 1.2312- both zones of interest for possible downside exhaustion IF reached. Ultimately, a breach / close above 1.2774 is needed to mark resumption with such a scenario exposing subsequent resistance objectives at the 2020 yearly open / 38.2% retracement at 1.2975-1.3023.

Bottom line: The USD/CAD rally exhausted into uptrend resistance at the yearly high-week close this week- bulls may be at risk near-term. From a trading standpoint, rallies should be limited to the yearly open at 1.2713IF the correction interpretation is correct – ultimately a deeper pullback may offer more favorable opportunities closer to trend support with a breach / close higher exposing objectives into 1.30. Keep in mind the FOMC interest rate decision is on tap next week – stay nimble. Review my latest Canadian Dollar Price Outlook for a closer look at the near-term USD/CAD technical trade levels.
For a complete breakdown of Michael’s trading strategy, review his Foundations of Technical Analysis series on Building a Trading Strategy
Canadian Dollar Trader Sentiment – USD/CAD Price Chart

- A summary of IG Client Sentiment shows traders are net-long USD/CAD - the ratio stands at +2.28 (69.50% of traders are long) – typically bearish reading
- Long positions are8.95% higher than yesterday and 30.47% higher from last week
- Short positions are unchanged than yesterday and 31.76% lower from last week.
- We typically take a contrarian view to crowd sentiment, and the fact traders are net-long suggests USD/CAD prices may continue to fall. Traders are further net-long than yesterday and last week, and the combination of current positioning and recent changes gives us a stronger USD/CAD-bearish contrarian trading bias from a sentiment standpoint.
| Change in | Longs | Shorts | OI |
| Daily | -2% | 7% | 5% |
| Weekly | -30% | 38% | 13% |
---
US / Canada Economic Calendar
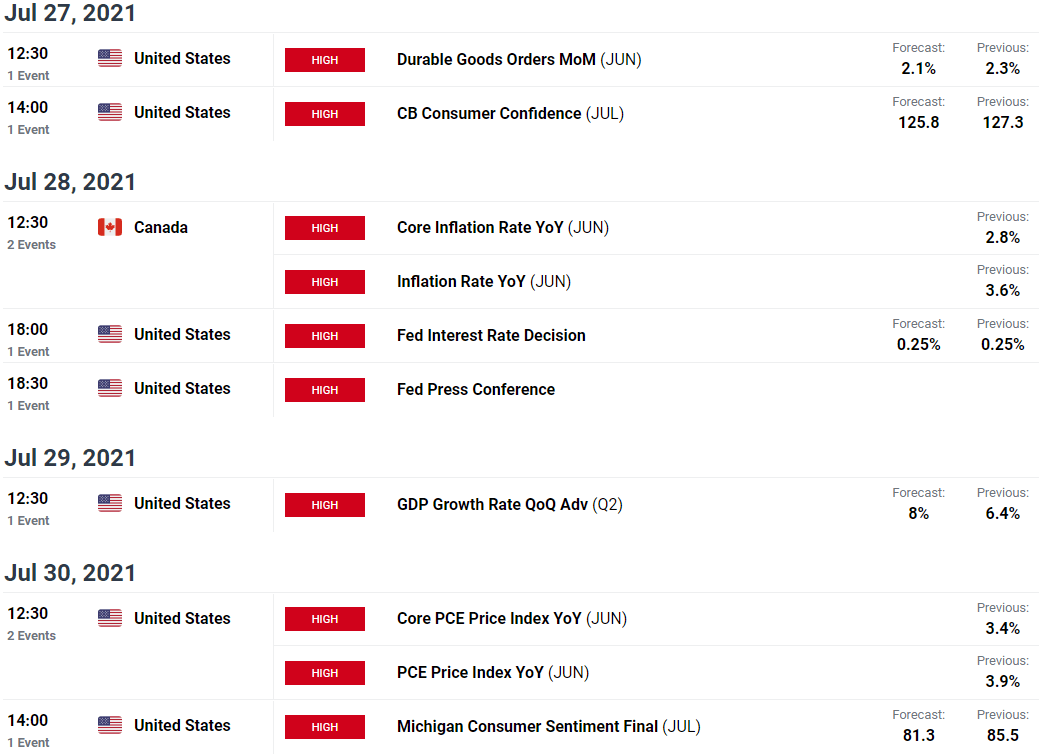
Economic Calendar - latest economic developments and upcoming event risk.
Active Weekly Technical Charts
- Australian Dollar (AUD/USD)
- Crude Oil (WTI)
- Sterling (GBP/USD)
- Euro (EUR/USD)
- US Dollar Index (DXY)
- Gold (XAU/USD)
- New Zealand Dollar (NZD/USD)
- Japanese Yen (USD/JPY)
--- Written by Michael Boutros, Technical Currency Strategist with DailyFX
Follow Michael on Twitter @MBForex


