


US Dollar Technical Price Outlook: DXY Weekly Trade Levels
- US Dollar technical trade level update – Weekly Chart
- USD price breakout stalls at the yearly high-week- risk for inflection
- DXY weekly support at 91.74, 90.93 (bullish invalidation) – Resistance 93, breach exposes 93.76/88 (key)
The US Dollar Index rallied nearly 0.7% into the start of August with DXY trading above 92.70 ahead of the US close on Friday. The advance keeps the price below the objective 2020 high-close and while the broader focus remains constructive- we’re looking for possible price inflection into resistance just higher. These are the updated technical targets and invalidation levels that matter on the US Dollar Index weekly price chart. Review my latest Strategy Webinar for an in-depth breakdown of this DXY technical setup and more.
US Dollar Index Price Chart – DXY Weekly
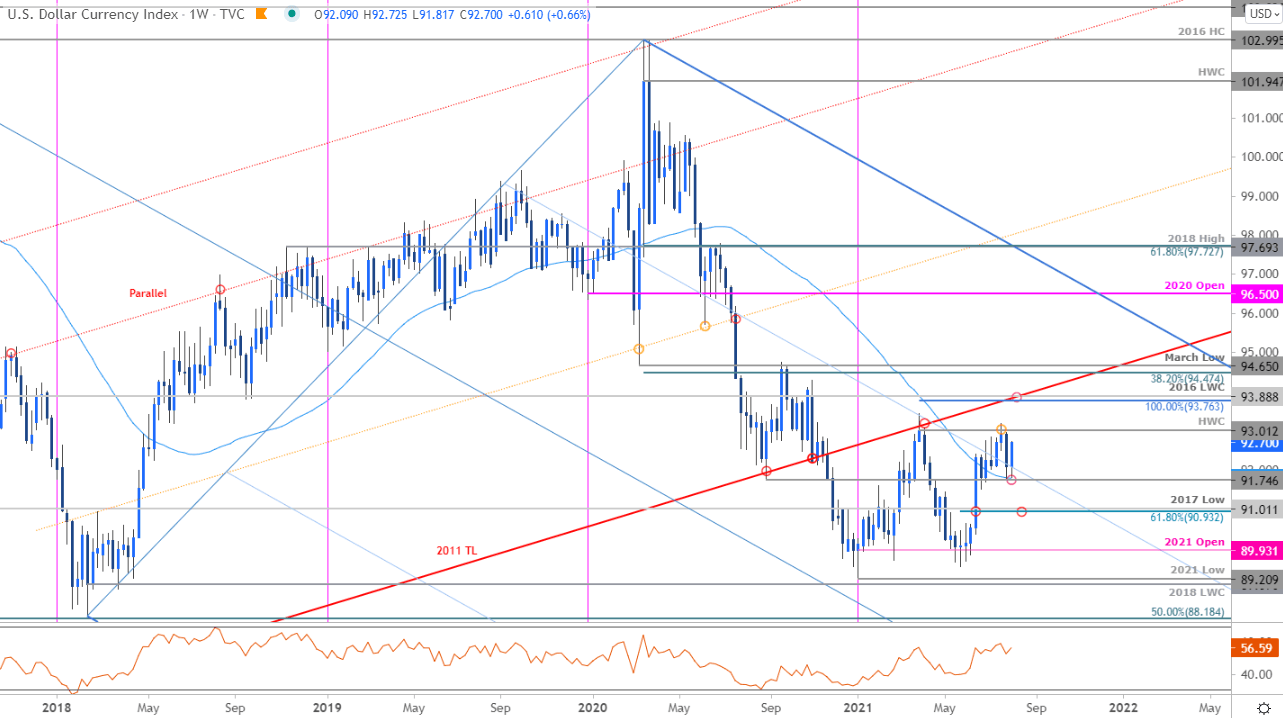
Chart Prepared by Michael Boutros, Technical Strategist; US Dollar Index on Tradingview
Notes: In last month’s US Dollar Weekly Price Outlook we noted to be on the lookout for an exhaustion low ahead of the 91-handle in DXY, “with a breach / weekly close higher exposing subsequent resistance objectives at the yearly high-week close at 93.01 and the 2016 low-week close at 93.88.” The index registered an intra-week high at 93.19 before pulling back into the close of July with price rebounding this week off confluent support at the 50-week moving average / August 2020 low at 91.75/76.
Weekly resistance remains with the objective yearly high-week close at 93.01. A breach / weekly close above this threshold is still needed to mark resumption towards the 2021 high at 93.43 and the 100% extension / 2016 low-week close at 93.76/88- look for a larger reaction in price there IF reached.Failure to clear the July highs would risk an exhaustive pullback here with a break below the figure exposing more significant support / bullish invalidation at the 61.8% Fibonacci retracement / 2017 low at 90.93-91.01.
For a complete breakdown of Michael’s trading strategy, review his Foundations of Technical Analysis series on Building a Trading Strategy
Bottom line: The broader May rally in the US Dollar may be vulnerable while below 93 with the July opening-range taking shape just below. From a trading standpoint, look to reduce long-exposure / raise protective stops on a probe of this key zone with a breach / close above needed to keep the long-bias viable. Ultimately, IF price fails up here, a pullback may offer more favorable opportunities closer to trend support with the broader outlook constructive while above 90.93. I’ll publish an updated US Dollar Price Outlook once we get further clarity on the near-term technical DXY trading levels.

Key US Data Releases

Economic Calendar - latest economic developments and upcoming event risk.
Previous Weekly Technical Charts
- Australian Dollar (AUD/USD)
- New Zealand Dollar (NZD/USD)
- Canadian Dollar (USD/CAD)
- Crude Oil (WTI)
- Sterling (GBP/USD)
- Euro (EUR/USD)
- Gold (XAU/USD)
- Japanese Yen (USD/JPY)
--- Written by Michael Boutros, Technical Strategist with DailyFX
Follow Michael on Twitter @MBForex


