


US Dollar Technical Forecast: Bullish
- The US Dollar re-engaged with resistance at 19-year highs earlier in the week, pulling back ahead of the Friday speech from FOMC Chair, Jerome Powell.
- That Friday speech brought considerable whip in the USD. Powell sounded very hawkish to my ears, and the follow-through response hours after his speech reflects that, with the USD having recovered earlier losses and equities pushing down to weekly lows.
- While I remain bullish longer-term on the USD, my quandary at the moment is one of positioning and timing, as EUR/USD is holding near the parity level and the short side of that move is still exhibiting symptoms of being crowded.
- The analysis contained in article relies on price action and chart formations. To learn more about price action or chart patterns, check out our DailyFX Education section.

It was a wild week for the US Dollar. The currency came into the week riding the bullish trend that had developed a couple weeks prior, just as the USD was grinding support around the 105.00 psychological level, and a 23.6% Fibonacci retracement. There was also a bull flag formation, with a bearish channel that had built from the day after CPI was released in July. The greenback broke through that formation in the middle of August and bulls held control of price action all the way until a re-test of the prior high at 109.25.
That price came into play on Tuesday and stalled the advance.
The Friday speech from Chair Powell, in my opinion, was very hawkish and direct. It highlighted a Fed chair that’s prioritizing the fight against inflation because, frankly, he has to. Failing to tame inflation could open a can of pain down-the-road that the Fed may not have tools to fight, without creating some other dislocation elsewhere in markets. Speaking of the word ‘pain,’ Powell actually used that exact term to describe the collateral effect that will come from what the Fed has on the horizon.
The big takeaway for me from the Jackson Hole speech from Powell is that he’s slowly but carefully ramping up the hawkish language. And if we look at the meme stock rallies that developed on the back of the July rate decision, when Powell merely said that the Fed was at the ‘neutral rate,’ it’s pretty clear that there’s still quite a bit of excess capital in financial markets. And that’s precisely what the Fed needs to address in order to get inflation down. So it seems this will take some time as the Fed continues to slowly ratchet up the hawkish language while still hiking rates and hoping that inflation gives more evidence that it’s already peaked.
There’s another factor of consideration and it’s unrelated to the Fed: EUR/USD continues to grind around the parity handle. This week saw another big test around that area of prices and given its 57.6% allocation into the DXY, it’s going to be difficult for the USD to put in any significant moves without at least some participation from the Euro.
USD
Given how messy price action was on Friday, I’m going to start longer-term here. Current resistance is showing at a long-term Fibonacci level of 109.14. This is the 76.4% retracement of the 2001-2008 major move in the USD. It came into play in July, which led to that reversal through the end of last month, and it came back into play on Tuesday of this week, once again holding bulls at bay. And, shorter-term, this led to a possible double-top formation that I’ll look at below.
US Dollar Monthly Price Chart
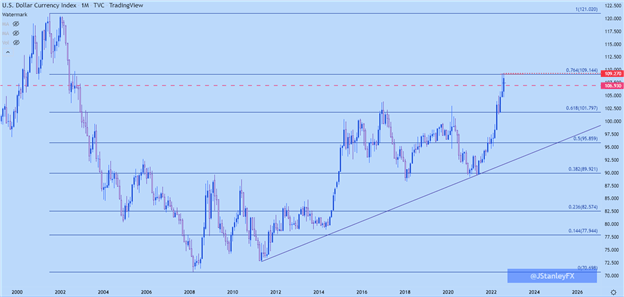
Chart prepared by James Stanley; USD, DXY on Tradingview
Going down to the weekly chart and there’s been a very aggressive bullish trend getting priced-in here. Given the v-shaped reversal that showed in August, the weekly chart carries continued breakout potential despite its volatile backdrop.
Price stalling right at resistance from that Fibonacci level opens the door for a possible reversal pattern. A double top is bearish – but to activate, price has to breach below the neckline, which is the lowest point between the two tops. On my chart, that’s down at 104.71, a breach of which opens the door for reversal potential. But for now, this chart is still bullish as prices are holding very near recently-established 19-year-highs.
US Dollar Weekly Price Chart
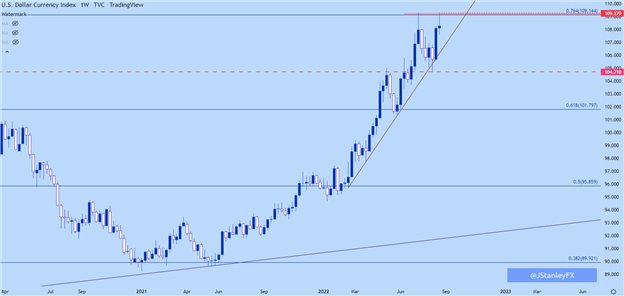
Chart prepared by James Stanley; USD, DXY on Tradingview
EUR/USD
Europe is not in a good spot, and fundamentally I am far from a bull on the Euro. I do hope that things get better but I know markets care little about my hope, so I try to see such matters objectively. There’s a lot of vulnerabilities, particularly as we go into a winter with a war ongoing in East Europe.
This puts the ECB in a very bad spot as the bank doesn’t quite have the same flexibility to hike rates in effort of stemming inflation as the Fed. This has created a disparity in rates between the Euro and US Dollar. That growing disparity has already created a massive move in EUR/USD that’s pushed the pair to the parity psychological level.
Psychological levels are usually big deals and the price of parity in EUR/USD is especially important. When the pair was jumping in 2002, even in the midst of an aggressively bullish up-trend, it took six months to break through parity.
The price of 1.0001 simply feels more expensive to many people than just two pips above .9999, and that can create changes in pricing dynamics. This is why we can look back on the chart and see the all-time-high in EURUSD around the 1.6000 level.
EUR/USD Monthly Chart
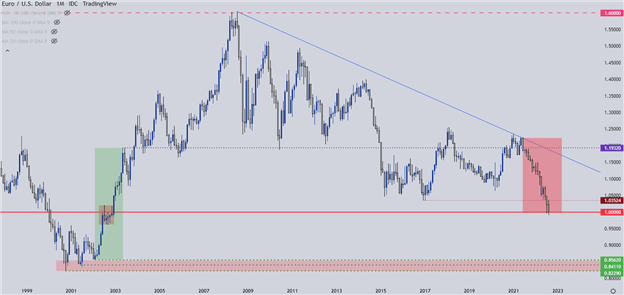
Chart prepared by James Stanley; EURUSD on Tradingview
From the weekly EUR/USD chart, we can see that continued struggle for bears around the parity level. Breaking below may simply take more time. I remain bearish EUR/USD and bullish USD, but I question the timing of downside continuation in EUR/USD at this specific moment in time.
Which means – breakout strategies can be used if/when supports are taken-out. Otherwise, I can look for price to pullback to resistance at prior spots of support, such as what happened in EUR/USD with 1.0340 two weeks ago.

EUR/USD Weekly Chart
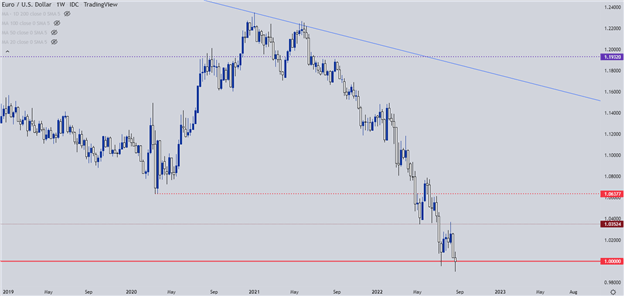
Chart prepared by James Stanley; EURUSD on Tradingview
GBP/USD
Cable is working through some similar context as EUR/USD above, with the exception of the long-term spot of support holding up the lows. The pair put in a sizable breakdown two weeks ago that I had looked into just ahead of the breach. I had looked into GBP/USD earlier this week, based around a build of support looking for pullback themes. That pullback showed up and price ran right into resistance, after which sellers pushed it back to support.
Normally, with a backdrop of that nature I’ll look for continuation, and this could be an item of interest for USD bulls for next week as GBP/USD carries breakout potential.
GBP/USD Daily Chart
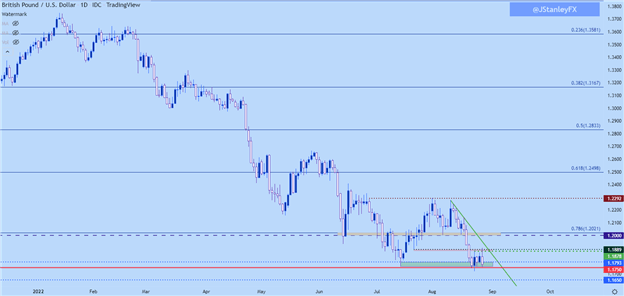
Chart prepared by James Stanley; GBPUSD on Tradingview
USD/CAD
I had looked into USD/CAD on Thursday, sharing that I thought it was perhaps one of the more attractive venues for USD bears.
This is drawn from a couple of factors, key of which is the divergence that’s shown in USD and USD/CAD trends since May of last year. But, more recently, USD/CAD has retained a bearish feel as price is holding resistance around the 38.2% retracement of the 2020-2021 major move; and there’s also a bear flag formation at work.
Near-term, resistance has had a penchant to hold around the 1.3000 level and given the raging USD-trends showing elsewhere with breakdowns in EUR/USD and GBP/USD, this more tepid display of USD-strength is a notable outlier in USD/CAD.
USD/CAD Weekly Chart
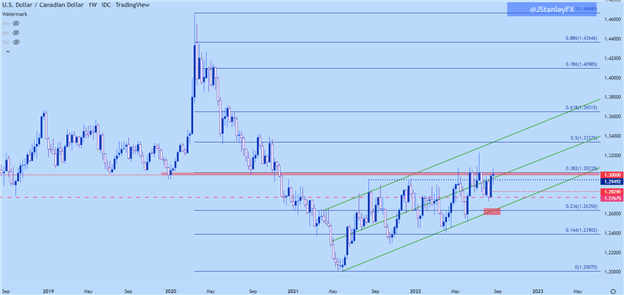
Chart prepared by James Stanley; USDCAD on Tradingview
USD/JPY
The weekly chart of USD/JPY is somewhat of a challenge at the moment. There’s almost 900 pips of deviation between the July high and the August low.
Shorter-term, there was an ascending triangle that had built that yielded to a topside breakout this week and, as yet, that zone of prior resistance hasn’t been tested as support. That can keep the door open for bullish continuation scenarios inside of the intermediate-term range that’s built between 130.40 and 139.39.
USD/JPY Daily Chart
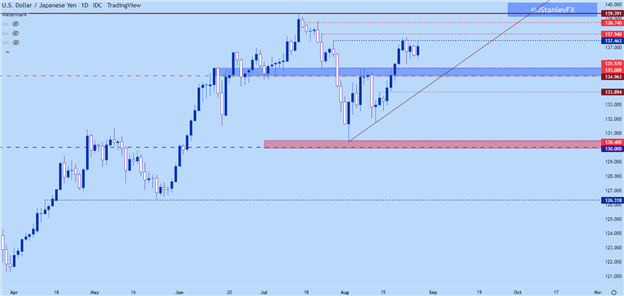
Chart prepared by James Stanley; USDJPY on Tradingview
--- Written by James Stanley, Senior Strategist, DailyFX.com & Head of DailyFX Education
Contact and follow James on Twitter: @JStanleyFX


