


US Dollar Talking Points:
- The US Dollar has just broken out to a fresh August high. This follows the earlier-week breakout from the bull flag formation.
- The big question at this point revolves around continuation, and as I’ve been highlighting, that’s likely going to have something to do with w hether bears in EUR/USD are willing or able to drive prices back towards the parity handle and, perhaps even below it.
- The analysis contained in article relies on price action and chart formations. To learn more about price action or chart patterns, check out our DailyFX Education section.

The US Dollar is breaking out to fresh August highs this morning. This breakout has been setting up for around a week, and that follows a pullback in the currency that developed in mid-July, just after the release of a 9.1% headline CPI print.
Support played-in off of the 23.6% Fibonacci retracement of the May 21 – July 22 major move, that came into play a week ago. Price built a morning star formation around that level with bulls posing a break out of the bull flag on Monday.
US Dollar Daily Price Chart

Chart prepared by James Stanley; USD, DXY on Tradingview
As I wrote on Tuesday, there was continued breakout potential as price had held right at the prior August high. Prices pulled back, finding support in a key zone around the 106.68 level.
Coming into this morning, there was an ascending triangle formation that I highlighted on Twitter just ahead of the breakout. And prices have pushed ahead and are now trading at fresh August highs, levels that haven’t been traded at since the July FOMC rate decision.
The next zone of resistance on my chart is at 107.40-107.48.
US Dollar Two-Hour Price Chart

Chart prepared by James Stanley; USD, DXY on Tradingview
EUR/USD
This, in my opinion, is what will decide how long that USD breakout might run for. I wrote about this part of the story yesterday in the EUR/USD Deep Dive article.
But, in summary, the parity level is a massive psychological level and for sellers to sustain a break below that price, we may need some more motivation on the fundamental side of the equation. To be sure, divergence remains between the US and European economies. But, given the run that we’ve seen in US equities along with rates markets, it also appears that there’s still some harboring expectation that the FOMC may be nearing a pause point, to some degree.
That can equalize or at the least bring question to rate hike expectations, as markets look for the ECB to gear up a bit more while waiting for the Fed to show signs of less aggression.
In EUR/USD, price is now moving towards the bottom of recent range support, around the 1.0100 level. Below that and down to parity, there’s somewhat of a gray area given proximity to parity.

EUR/USD Two-Hour Price Chart
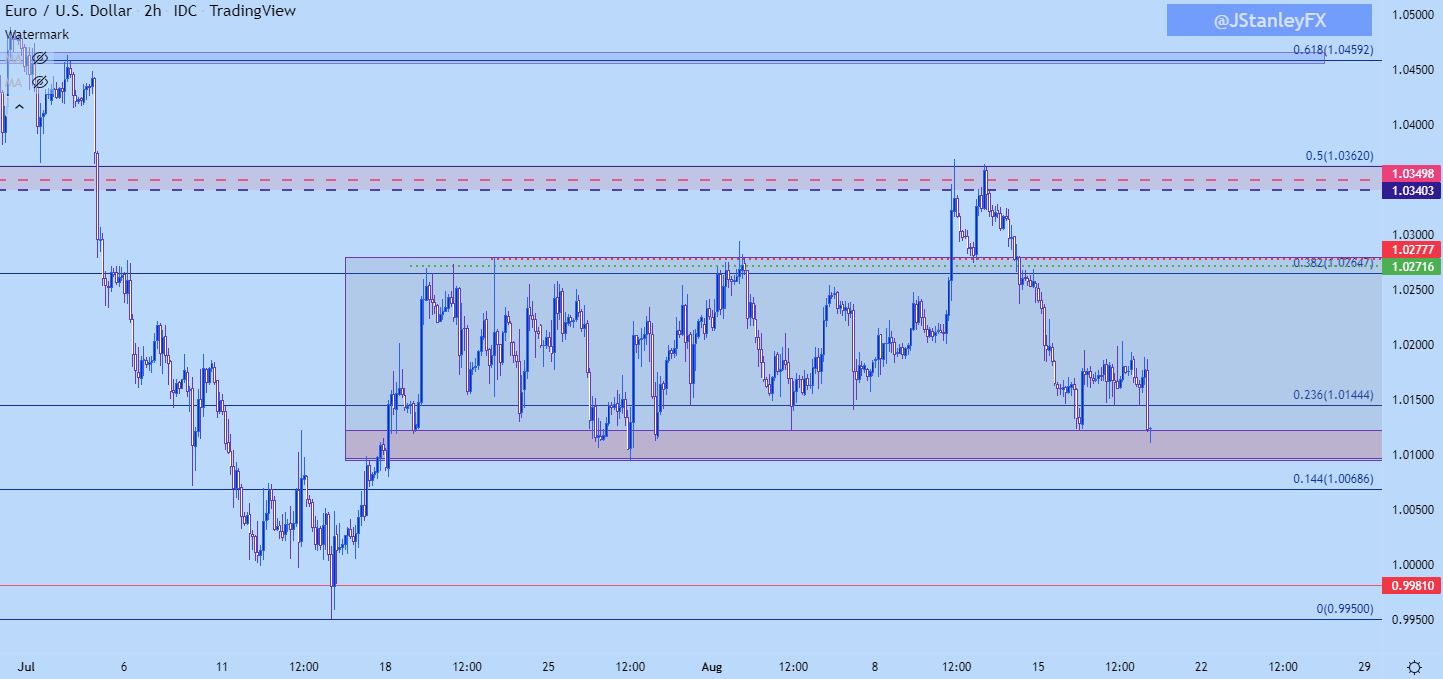
Chart prepared by James Stanley; EURUSD on Tradingview
GBP/USD
Cable looks like its setting up for breakdown potential to my eyes. I’ve been following the pair for bullish themes of late, with a bullish break from a falling wedge last week.
But, it’s what happened after that has dimmed the lights on that theme, as buyers couldn’t push up for a re-test at 1.2292 and since then we’ve seen lower-highs coming back into the equation. On Tuesday, I looked at another support test at a key zone – which did lead to a bounce. But, that bounce also printed a lower-high, highlighting bearish potential.
On the support side of the equation, 1.2000-1.2021 remains relevant, and sellers are digging a bit deeper into that spot, giving the appearance that it may soon be ready to yield to breakdowns.
GBP/USD Four-Hour Chart
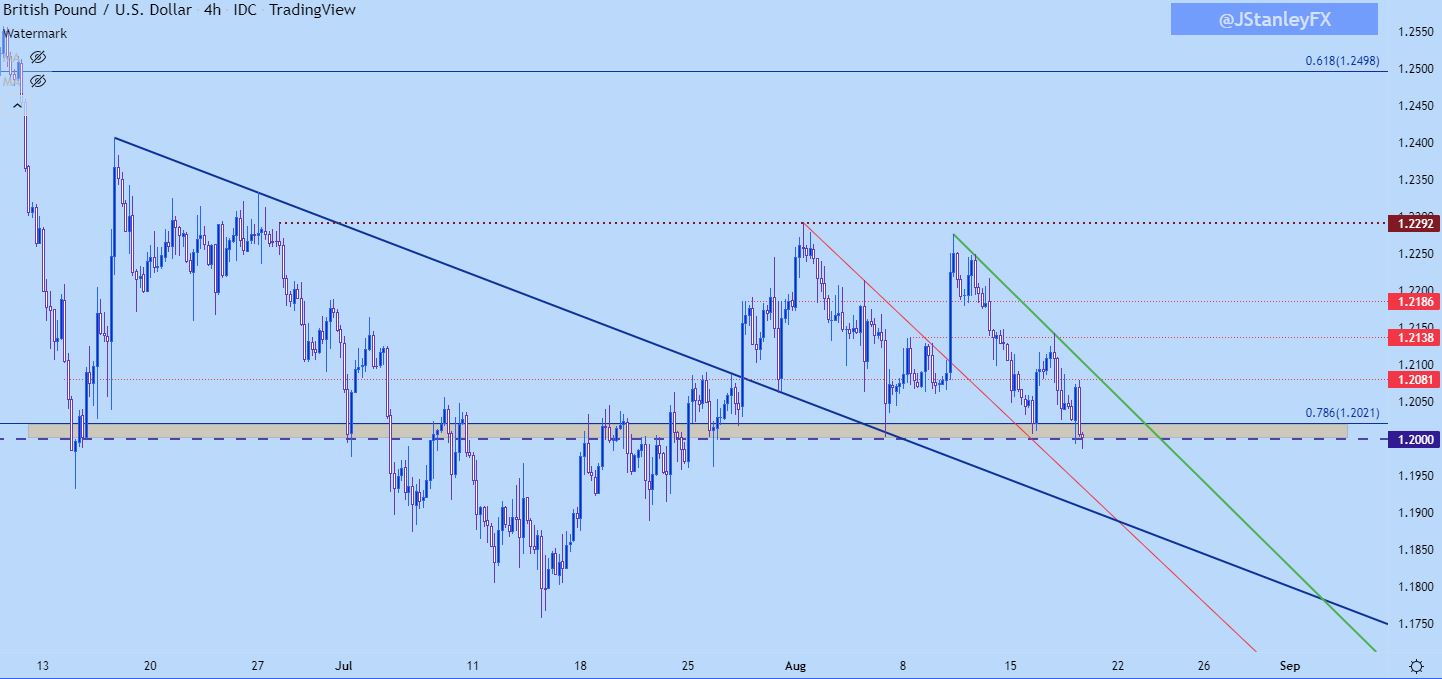
Chart prepared by James Stanley; GBPUSD on Tradingview
USD/CAD
As I’ve been sharing, USDCAD short-term looks quite messy. Longer-term, however, brings quite a bit of interest.
Price has been choppy and range-bound for the past month. Resistance has been especially sticky, and this shows up around 1.2950 but becomes more prominent from 1.3000-1.3024. And longer-term, price remains in a bear flag formation.
This is something that may take some time to set up, but notably, as the USD massive rally has been taking-hold against most every other currency in the world, USD/CAD has simply been building a corrective formation that retains a bearish appeal.

USD/CAD Weekly Chart

Chart prepared by James Stanley; USDCAD on Tradingview
USD/JPY
There’s an ascending triangle in USD/JPY at the moment, with resistance holding right around the 135.00 psychological level. There’s support potential around 133.90 for pullbacks. And next resistance sits overhead, around 137.00.
This is short because there’s not really much more to say on the matter until either the breakout takes hold or until it flounders.

USD/JPY Eight-Hour Chart

Chart prepared by James Stanley; USDJPY on Tradingview
--- Written by James Stanley, Senior Strategist, DailyFX.com & Head of DailyFX Education
Contact and follow James on Twitter: @JStanleyFX


