


Canadian Dollar, USD/CAD Talking Points:
- USD/CAD continues to find resistance around the 1.3000 psychological level, as has been the case for the better part of the past three months.
- While the USD trend has taken off to fresh highs this year, USD/CAD has remained much more subdued and longer-term, there’s even some bearish potential given that divergence between the two trends and the build of a bear flag formation with a resistance hold around a 38.2% Fibonacci retracement.
- The analysis contained in article relies on price action and chart formations. To learn more about price action or chart patterns, check out our DailyFX Education section.

The US Dollar has put in a massive move since last May when the currency was grinding at the 90 handle on DXY.
That’s around the time that the Fed started shifting their verbiage from extremely dovish to a bit less so, even as inflation was starting to spike above three and four percent. It wasn’t until September that the bank actually started to talk up possible rate hikes, but markets aren’t one to wait around and the trend has already gotten started by then.
From that low set last May – the US Dollar has gained as much as 22.07%. This calendar year alone the Greenback has already put in its largest annual gain since 1984 – and we still have four full months left.
Interestingly – USD/CAD hasn’t quite kept up with that move. At this point, USD/CAD is up a mere 7.83% from that low last May – and the maximum amount that the move has shown was 10.13%, so less than half of that than the US Dollar.
US Dollar (red line) v/s USD/CAD (candles) Since June, 2021
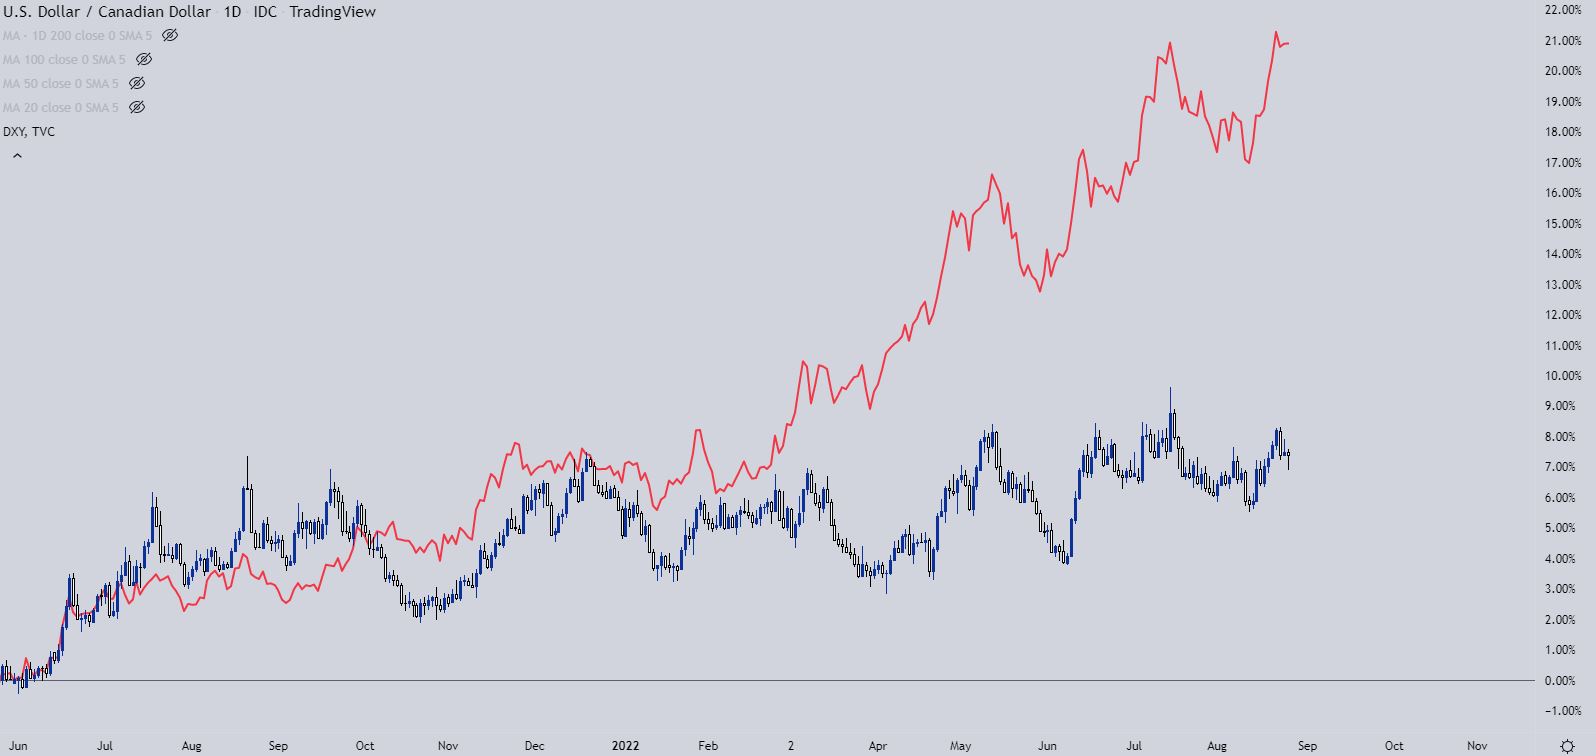
Chart prepared by James Stanley
What Explains the Deviation?
This part is fairly simple since the US Dollar is present in the USD/CAD quote. The difference between DXY performance and USD/CAD has been strength in the Canadian Dollar, which has acted as a drag on that bullish trend in the USD and which has shown quite visibly in DXY.
More interesting than what is, is what might be. There seems little expectation that the US Dollar bullish trend will cool anytime soon. That type of sentiment often exhibits a crowded traded and while it doesn’t necessarily denote a timing element, it does highlight something of interest, particularly if a change of tides does occur at some point.
And – even if it doesn’t, it highlights something that may be usable elsewhere, such as taking the Canadian Dollar strength that’s acted as a buffer in the DXY trend, and extrapolating it elsewhere, such as CAD/JPY.
In the major pair of USD/CAD, longer-term, there remains some bearish qualities here and in my opinion, that’s what makes this so utterly interesting. The USD has been ripping almost everywhere but, here in USD/CAD, it’s merely amounted to a 38.2% retracement, building a bear flag formation along the way.
And it’s from no fault of bulls, as buyers have been pushing for a breakout for the better part of the past three months, continually being thwarted at the zone of resistance around the psychological level of 1.3000.
USD/CAD Weekly Price Chart
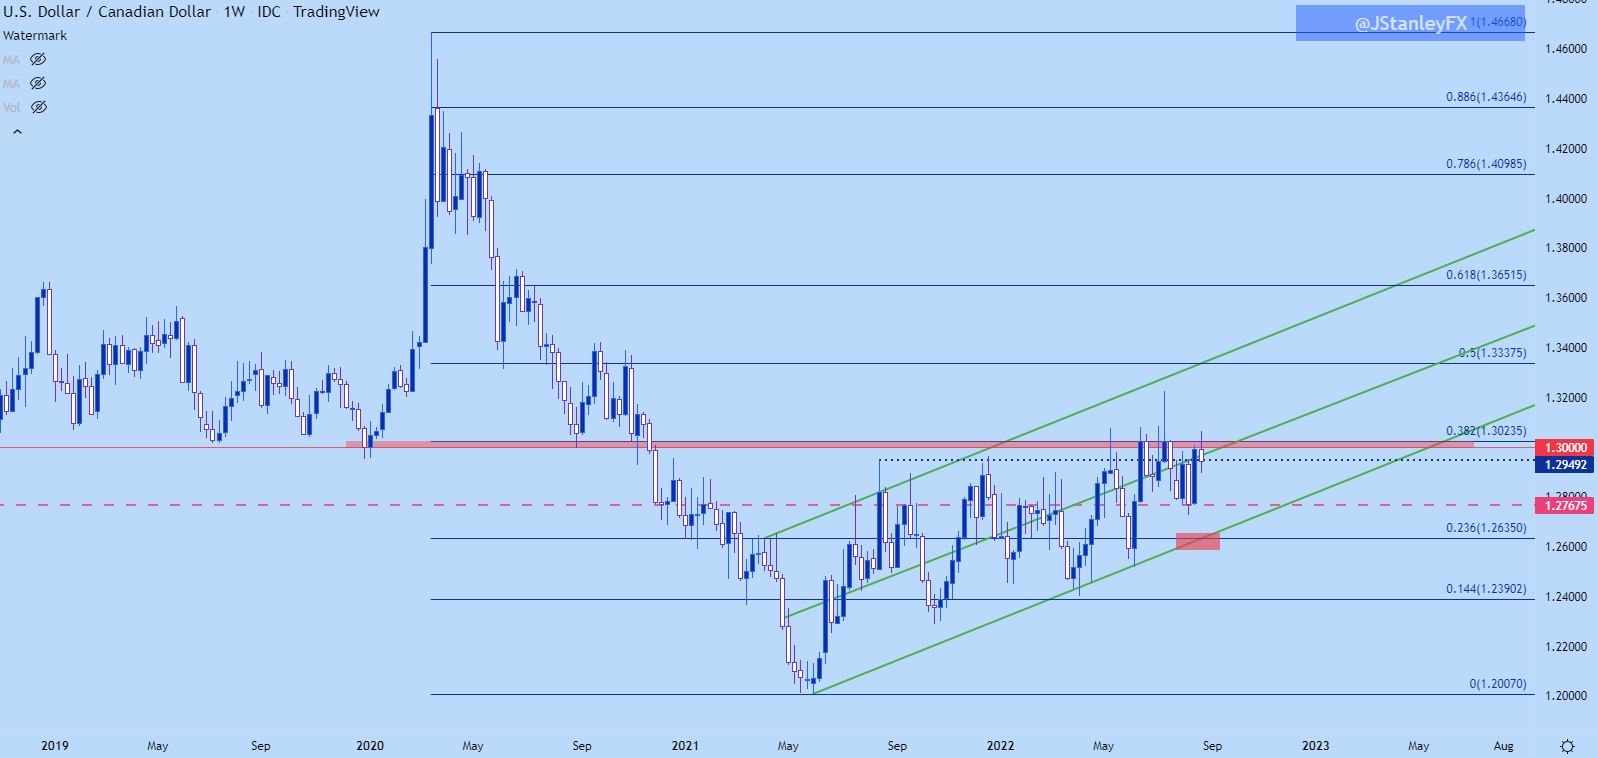
Chart prepared by James Stanley; USDCAD on Tradingview
I looked into USD/CAD last week and noted that shorter-term charts look very messy to me. That’s still the case, and I think it’s because there’s a longer-term dynamic at work.
A couple factors of consideration are oil prices, which are threatening a larger bullish breakout as I’ve been following through this month. Earlier in August, I pointed out a falling wedge. That’s since yielded to a bullish breakout and at this point, buyers are trying to break-through the 95.00 psychological level. If higher-low support prints and oil prices re-test back-above the 100 handle, that can be another beneficial driver behind CAD-strength.
We’re not quite there yet on oil but in USD/CAD, the 1.3000 zone continues to be a relevant area of resistance as it came into play yet again this week. But, one item of note from the weekly chart below – we haven’t had a weekly close in USD/CAD above 1.3024 since November of 2020.
And there’s a shorter-term level of note at 1.2768, which I had pointed out at the end of July as a relevant level in the short-term noise that had developed in the pair. That price has since helped to hold the August lows and remains of interest moving forward.
USD/CAD Weekly Chart

Chart prepared by James Stanley; USDCAD on Tradingview
USD/CAD Shorter-Term
Back to that shorter-term chart, which still looks messy to me. There’s been a few trends firing along the way but little that’s held for long. And when I see this, I often attribute it to a bigger picture theme in effect.
At this point, given the move off of the resistance test above 1.3000, there could be continued scope for pullback. For deeper support, there’s deeper support potential around 1.2829, after which the 1.2768 zone comes into the picture. For short-term resistance, 1.2950 is of interest, as a spot just inside of the 1.3000 psych level.
USD/CAD Four-Hour Chart

Chart prepared by James Stanley; USDCAD on Tradingview
--- Written by James Stanley, Senior Strategist, DailyFX.com & Head of DailyFX Education
Contact and follow James on Twitter: @JStanleyFX


