


US Dollar Talking Points:
- The US Dollar is pulling back after a breakout from a bull flag formation yesterday.
- At the source of the USD breakout was a re-emergence of EUR/USD weakness following last week’s flare to resistance.
- The analysis contained in article relies on price action and chart formations. To learn more about price action or chart patterns, check out our DailyFX Education section.

The US Dollar has started the week with strength and at this point, the currency is threatening a breakout to fresh August highs. The USD has already broken through the bull flag formation looked at in this week’s technical forecast, and buyers have so far continued to push. Tomorrow’s release of FOMC minutes may be a notable factor given the market response after that meeting, which was decisively positive for the equity trade and negative for the USD and rates.
Notably, the current 19-year high in DXY printed right after CPI numbers were released in July to the tune of 9.1%. The currency has continued to pull back, through the FOMC rate decision and through last week’s CPI print.
US Dollar Daily Price Chart: Bull Flag Break
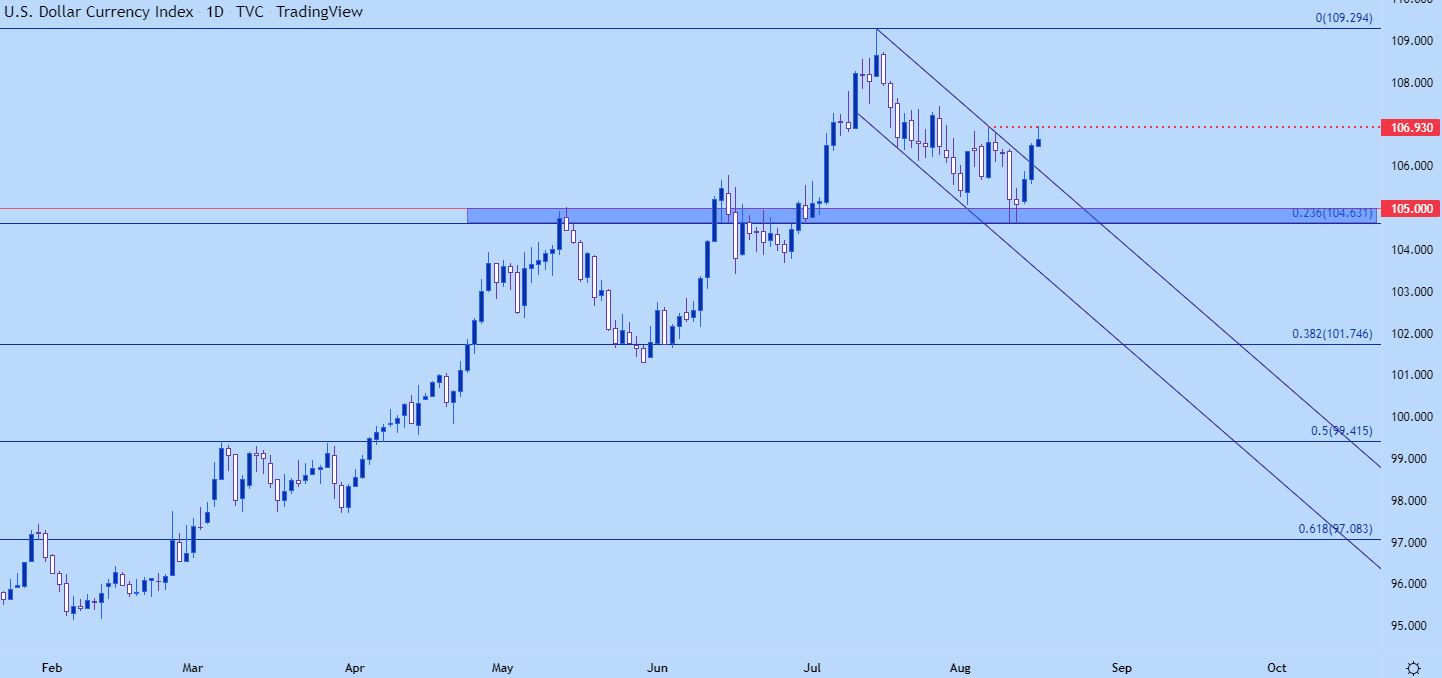
Chart prepared by James Stanley; USD, DXY on Tradingview
On a shorter-term basis, the Greenback pushed up for a test of the August high this morning and is seeing a bit of resistance play-in. This puts focus on how bulls respond to higher-low support and this can highlight continuation potential in the move. Price is currently testing through a support level around 106.68, and there’s another key spot around the Fibonacci retracement at 106.24.
US Dollar Four-Hour Chart
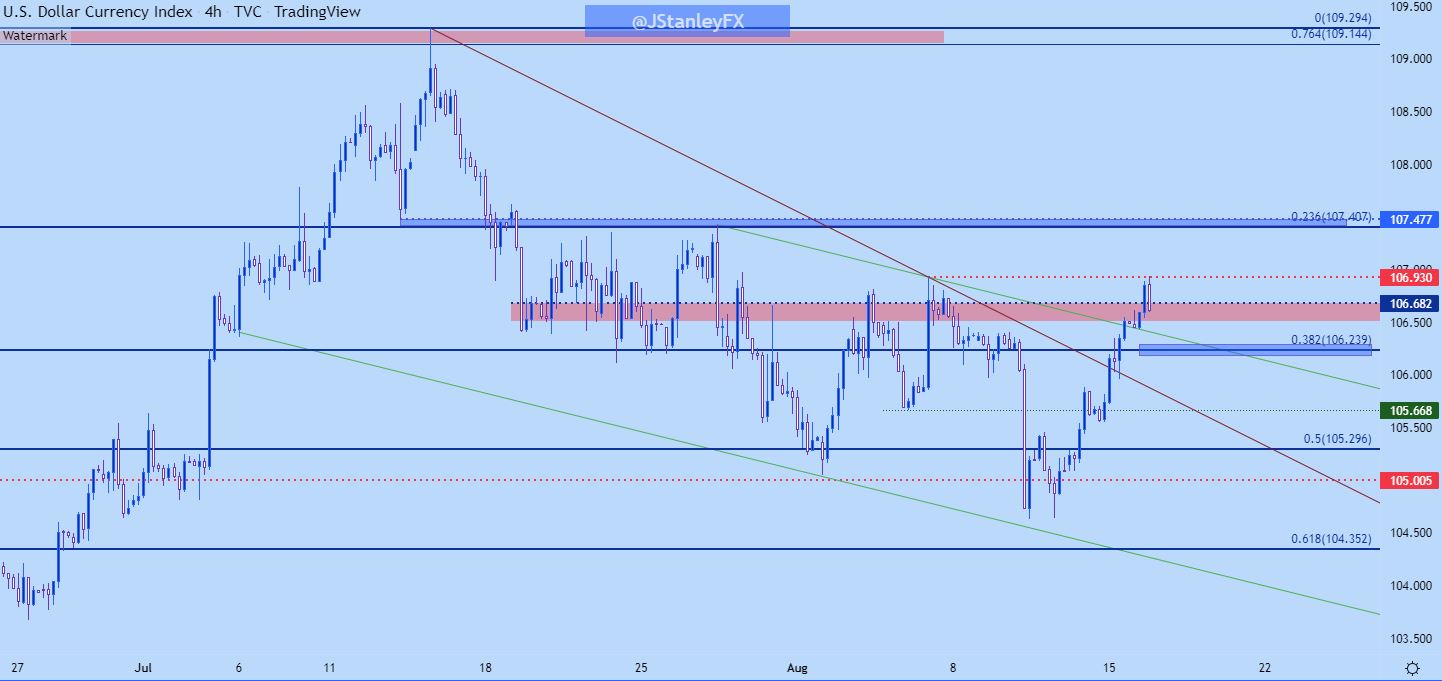
Chart prepared by James Stanley; USD, DXY on Tradingview
Since then, we’ve heard the rates theme walked back a bit by a series of hawkish Fed speakers and this has helped the USD to dig-in to support. The bullish move showing now appears to be anticipation and, in large part, driven by the Euro. I had looked into that on Thursday, right when EUR/USD was taking a second shot at resistance. That test failed and price has since reverted right back to range support.
EUR/USD Daily Price Chart
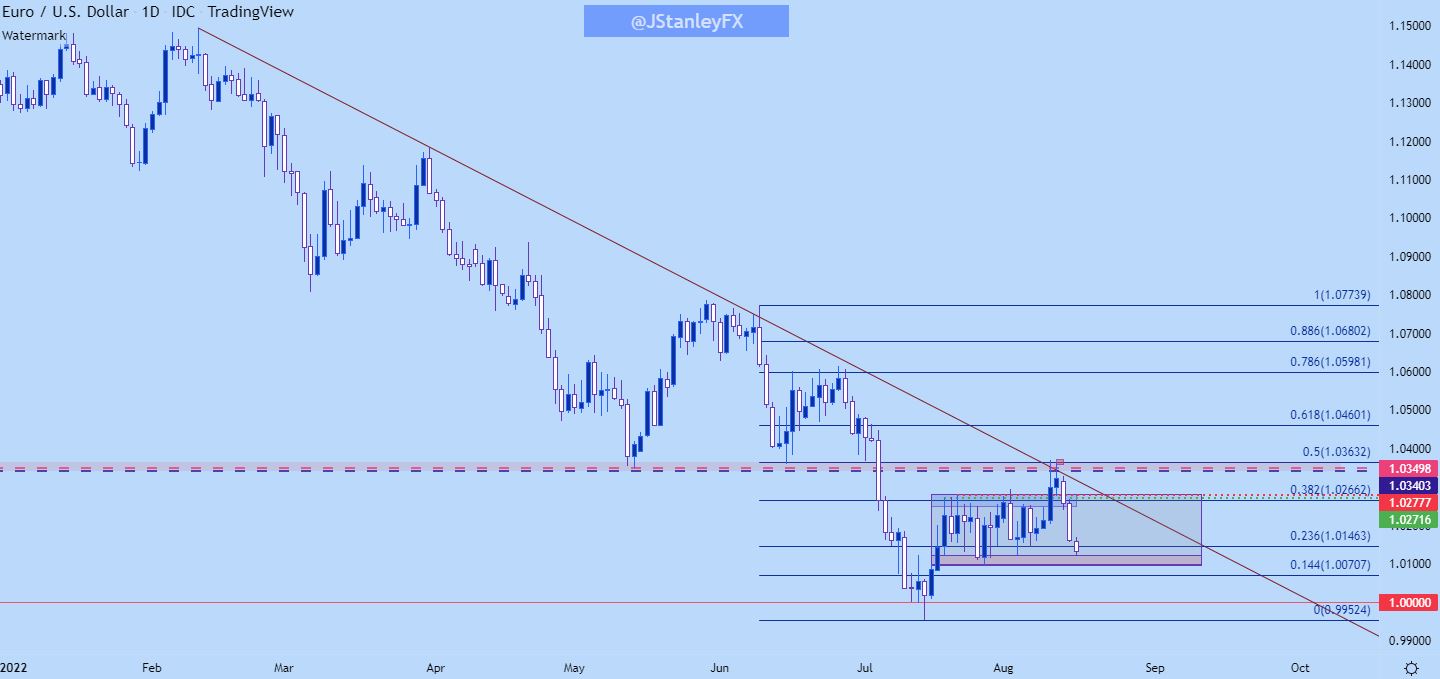
Chart prepared by James Stanley; EURUSD on Tradingview
EUR/USD Shorter-Term
With prices having reverted right back to range support, the big question in EUR/USD now is whether sellers can provoke another breakdown below parity and, perhaps more importantly, whether they can sustain the move while creating a deeper breakdown.
In July, that level was tested through and sellers pushed price about 50 pips below the big figure – and that’s when selling pressure dried up.
This is a major psychological level in action, and given how stretched the EUR/USD was when the parity break happened, the stakes for bearish continuation were raised. To continue pushing price lower – there needs to be more sellers coming into a market and when prices in EUR/USD are starting with a decimal and not a ‘1,’ that’s an adjustment that likely will take time… or fear.
In EUR/USD, I’m tracking range support down to around 1.0100, and there’s a Fibonacci level that was support-turned-resistance in mid-July that plots around 1.0071. And below that is the big figure of 1.0000.

EUR/USD Four-Hour Chart
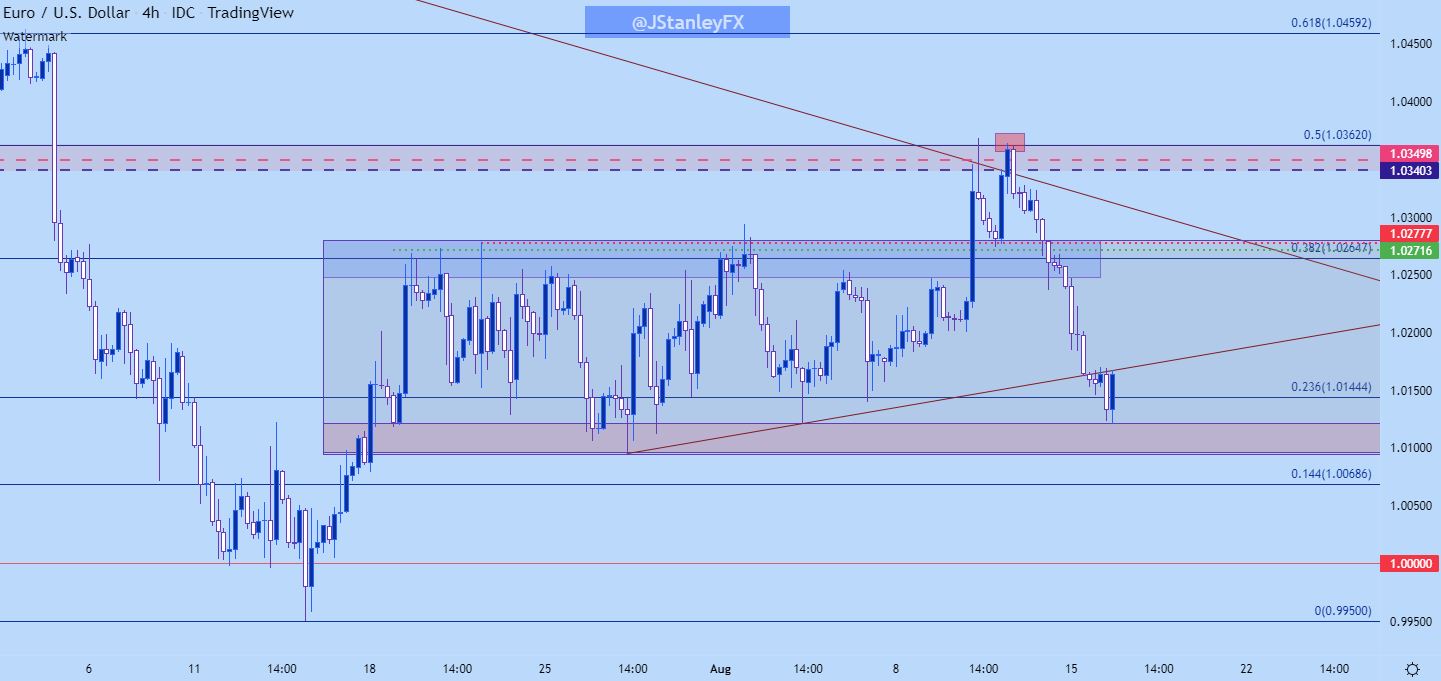
Chart prepared by James Stanley; EURUSD on Tradingview
GBP/USD Back to Support
GBP/USD put in a bullish breakout from a falling wedge formation last week on the back of that CPI release out of the US. The breakout couldn’t continue, however, and bulls pulled back ahead of a re-test at 1.2292. Price has since reverted right back to a key zone of support, spanning from the psychological level of 1.2000 up to the Fibonacci level at 1.2021.
That same spot of support helped to cauterize the low last week, so this also has tendencies of a range/mean-reversion setup should support hold in-place.
GBP/USD Four-Hour Price Chart
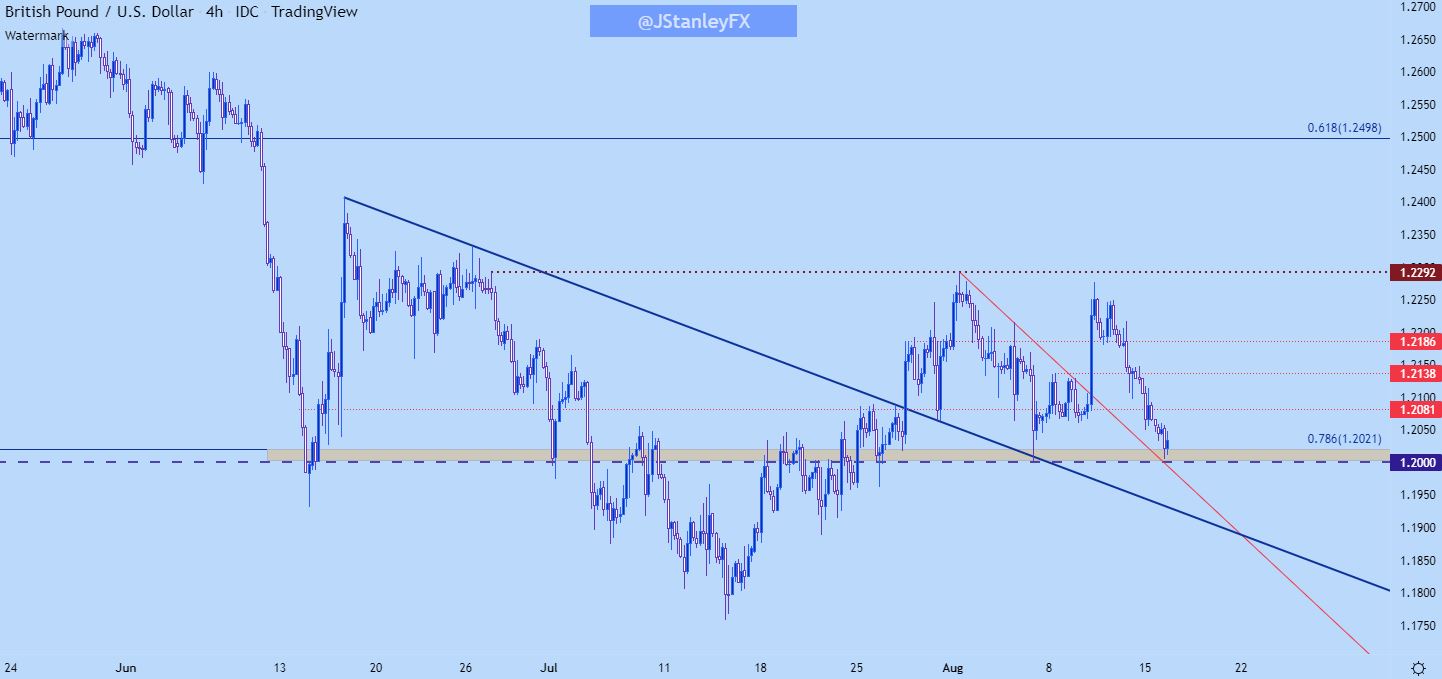
Chart prepared by James Stanley; GBPUSD on Tradingview
USD/CAD
USD/CAD on a shorter-term basis looks messy to me. From the weekly chart, however, there’s some considerable interest in longer-term trends, which appear to be on wait given the formation of the past three weekly candles.
Longer-term, there’s a bear flag formation in here. But, it’s no fault of bulls, even as the US Dollar has torn away against most currencies this year, USD/CAD has been continually stymied at the 1.3000 area of resistance. Support showed up last week at an interesting spot, 1.2768, which led to a bounce.
But, overhead resistance is lurking very nearby. There’s a couple spots of interest here, with the closest at a price level that’s tangled with multiple wicks, highlighting support/resistance potential in-front of the 1.3000 zone. And overhead, I’m tracking a resistance zone from 1.3000-1.3030. There hasn’t been a weekly close above that zone since November of 2020.

USD/CAD Weekly Price Chart
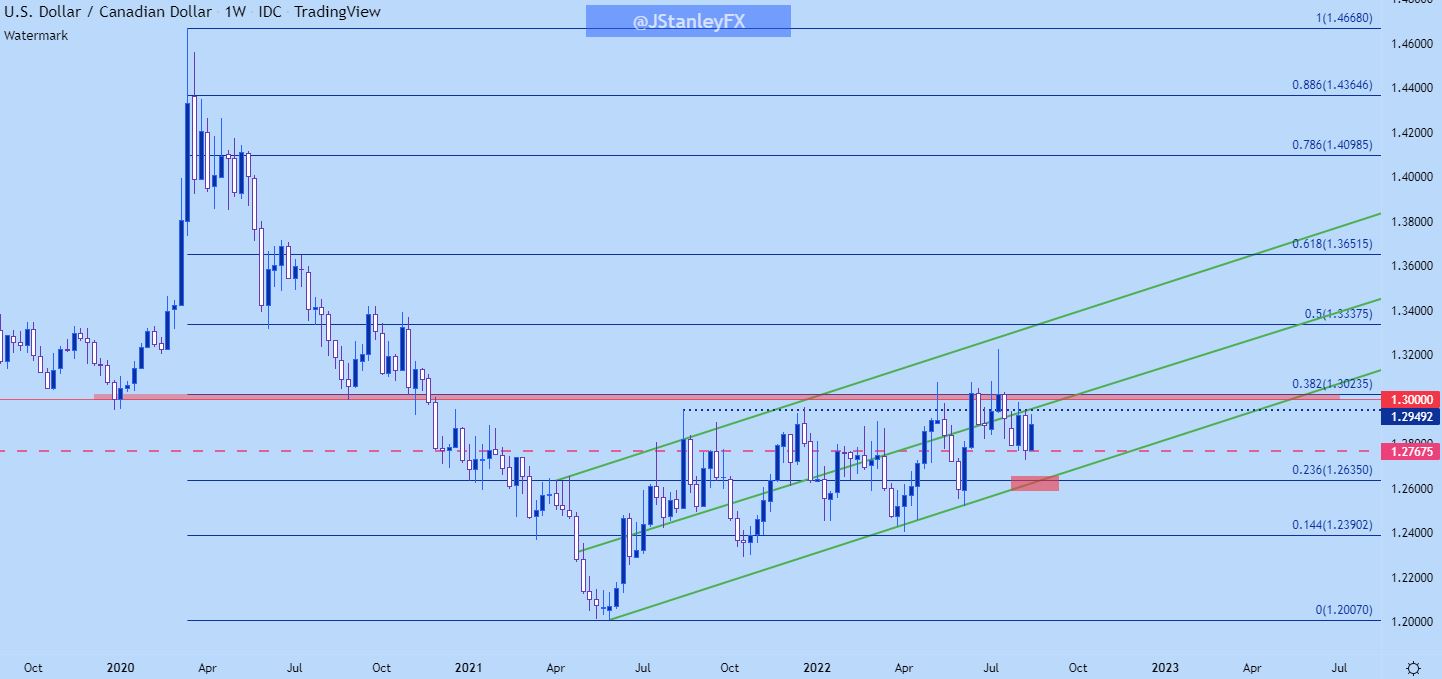
Chart prepared by James Stanley; USDCAD on Tradingview
USD/JPY
USD/JPY is approaching a key zone around the 135.00 handle that provided resistance earlier in August. There’s been a couple of notable themes already this month in USD/JPY, which came into August in the midst of an aggressive sell-off. That move was largely pushed by rates, which were falling after the July FOMC rate decision.
But, as Fed-speak took on a hawkish tone, strength quickly returned, pushing the pair back to the 135.00 level which has since held resistance.
Prices again snapped back after the CPI print last week and since then, buyers have been clawing back lost ground. At this stage, from the daily, I would consider this mean-reversion with breakout potential.
And given the price action response with the various drivers over the past week, I would bias the fundamental side of the equation as bullish, largely from the fact that the controllable factor, Fed-speak, was so decisively hawkish. The Fed is going to continue to hike rates, that is fairly clear; what is less so is how markets will respond and the correlation between short-term US rates and USD/JPY is too much to ignore for such a pensive macro theme.

USD/JPY Daily Price Chart
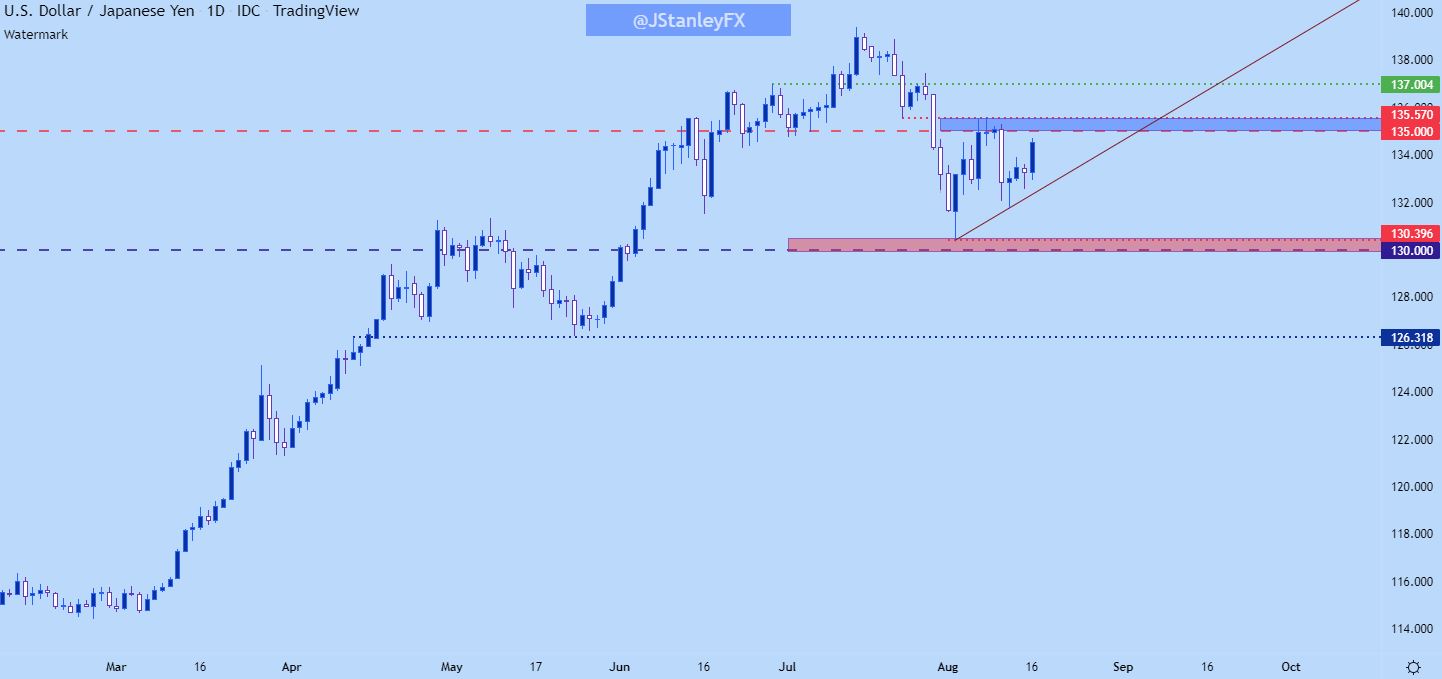
Chart prepared by James Stanley; USDJPY on Tradingview
--- Written by James Stanley, Senior Strategist, DailyFX.com & Head of DailyFX Education
Contact and follow James on Twitter: @JStanleyFX


