


Indices Technical Forecast: Neutral
- The S&P 500 ran into resistance on Tuesday at the 200 day moving average.
- The Nasdaq 100 was up for four consecutive weeks until this week’s pullback, with resistance holding at a major level.
- It was a doji this week for the Dow Jones after running into a bearish trendline.
- The analysis contained in article relies on price action and chart formations. To learn more about price action or chart patterns, check out our DailyFX Education section.

So, I want to get this out of the way up front: I’m bearish on US equities. I have been since the start of the year and haven’t really wavered. It was my Top Trade in Q2 and again in Q3. That worked out well in the second quarter but so far in the third, with a little over half of the period complete, it hasn’t worked as well. The Nasdaq launched-higher by more than 20% and the S&P 500 has rallied back to a key point of resistance. I’ve remained bearish, albeit patiently, waiting for the spot where sellers may come back into the fray to continue the longer-term, bigger-picture bearish trend. This is simply the most cogent way of approaching the matter, in my opinion, placing priority on risk management.

My thesis derives from both fundamental and technical factors. On the fundamental front, inflation remains really high. Maybe it’s topped, I’m not sure, and I don’t think anyone else knows either. But, it’s certainly not at the Fed’s 2% target and that’s the problem. Markets have grown accustomed to the Fed just waffling on any effort of tightening at the slightest hint of weakness. This conditioned market participants to buy the dip, whenever it might’ve shown.
But, there’s a big difference here from any of those prior instances and it’s inflation. I don’t think that elevated inflation will allow for the Fed put to remain in-play here. And the reason for that – is that I don’t think the US government can afford to take that risk, just as the risk of avoiding inflation all year last year massively blew up in their face.
In the early 1980’s, inflation had run even higher, as much as 13.5% in 1980. So, Paul Volcker raised rates up to 20% that year. Can you imagine that – 20% interest rates? The aim from Mr. Volcker was to drain excess reserves from the system. Raising rates to 20%, and providing opportunity cost, that did it in terms of motivation. CPI was at 6.1% in 1982 and then 3.2% in 1983 (all CPI data from Minneapolis Fed).
So, Volcker’s gambit worked. It took a few years but, it worked. The problem here – and the reason that the Fed cannot afford to let the problem get that bad – is because of the AMOUNT of debt that the US holds.
The US Debt-to-GDP ratio was below 40% in 1980. Today – it’s at an all-time-high of 137.2%. That’s a massive amount of debt that will need to be serviced at new higher rates as it comes due and needs to be replaced by other debt – more debt -at even higher rates.
Frankly – the United States cannot allow the problem of inflation to grow to levels in 1980. There’s simply not enough capital go around, and if we are looking at even 10% interest rates in the US – or half of what Paul Volcker had moved to in 1980 – well, we probably can’t afford that either. And likely the Fed is seeing this and wanting to avoid that possible check-mate scenario, especially at a time when relations with China aren’t great and that’s one more willing buyer of US debt that’s happy to sit on the sidelines.
Now – as far as timing that move – and the reason that I’m keeping a neutral forecast for this week’s technical forecast on equities…
S&P 500
I consider myself a trader first and an analyst second. So, when something rips 20%, as a trader, I know better than to just sit in a short and hope that things turn-around. That’s a rookie move, in my humble opinion. But, as an analyst, you have to have conviction for your calls, to some degree, or there won’t be much value in them.
This explains why I’m being patient and looking for a possible sign of bearish trends returning. From a technical basis, some potential showed up this week when price finally ran into the 200 day moving average on Tuesday. That held the highs through the end of the week and is helping to produce the first bearish weekly bar on the S&P 500 since the first-half of July.

S&P 500 Weekly Chart: 200 DMA Applied
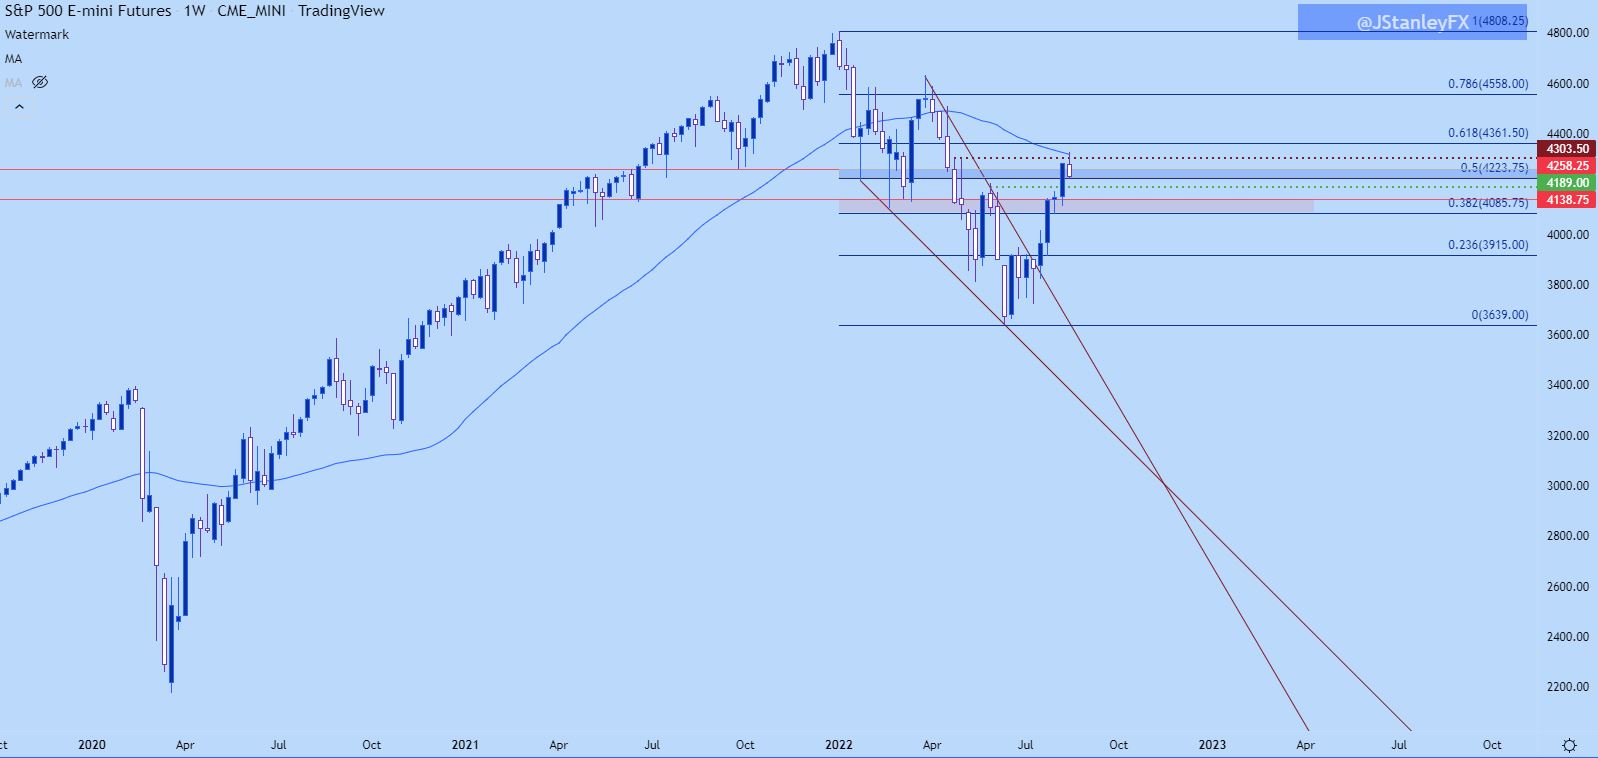
Chart prepared by James Stanley; S&P 500 on Tradingview
So, this could be the return of the bearish move, and next week brings the Jackson Hole Economic Symposium, so there’s ample opportunity for Central Banks to remind us of the need to fight inflation, and that could possibly produce the bearish catalyst. But, from technical structure, even the daily chart is a continuation of higher-highs and lows so showing a bullish price action trend that hasn’t yet been violated. And – there was a hold at the end of the week at a key level of 4223, which is the 50% mark of the 2022 sell-off.
Of note – are levels at 4189 which would signal a greater bearish push, opening the door for a move down to 4138 and then 4085. A break of that latter price would signal to me that bears are back and the bigger picture theme may be ready for continuation.
S&P 500 Daily Chart

Chart prepared by James Stanley; S&P 500 on Tradingview
Nasdaq 100
The Nasdaq never recovered to its 200 day moving average, but similar to the S&P 500 above it does retain some bullish qualities on the daily chart, key of which is a continued hold above higher-low support. The notable zone on my chart runs around the 13k psychological level and that’s been a big area since late-February, when first coming into the picture as support. It was support again in late-April and finally yielded to sellers in May, returning as resistance in June and then again in early-August.
Now, it’s back as possible support, and if sellers can push below that area – the longer-term bearish trend will be much more attractive, in my opinion.

Nasdaq Daily Price Chart
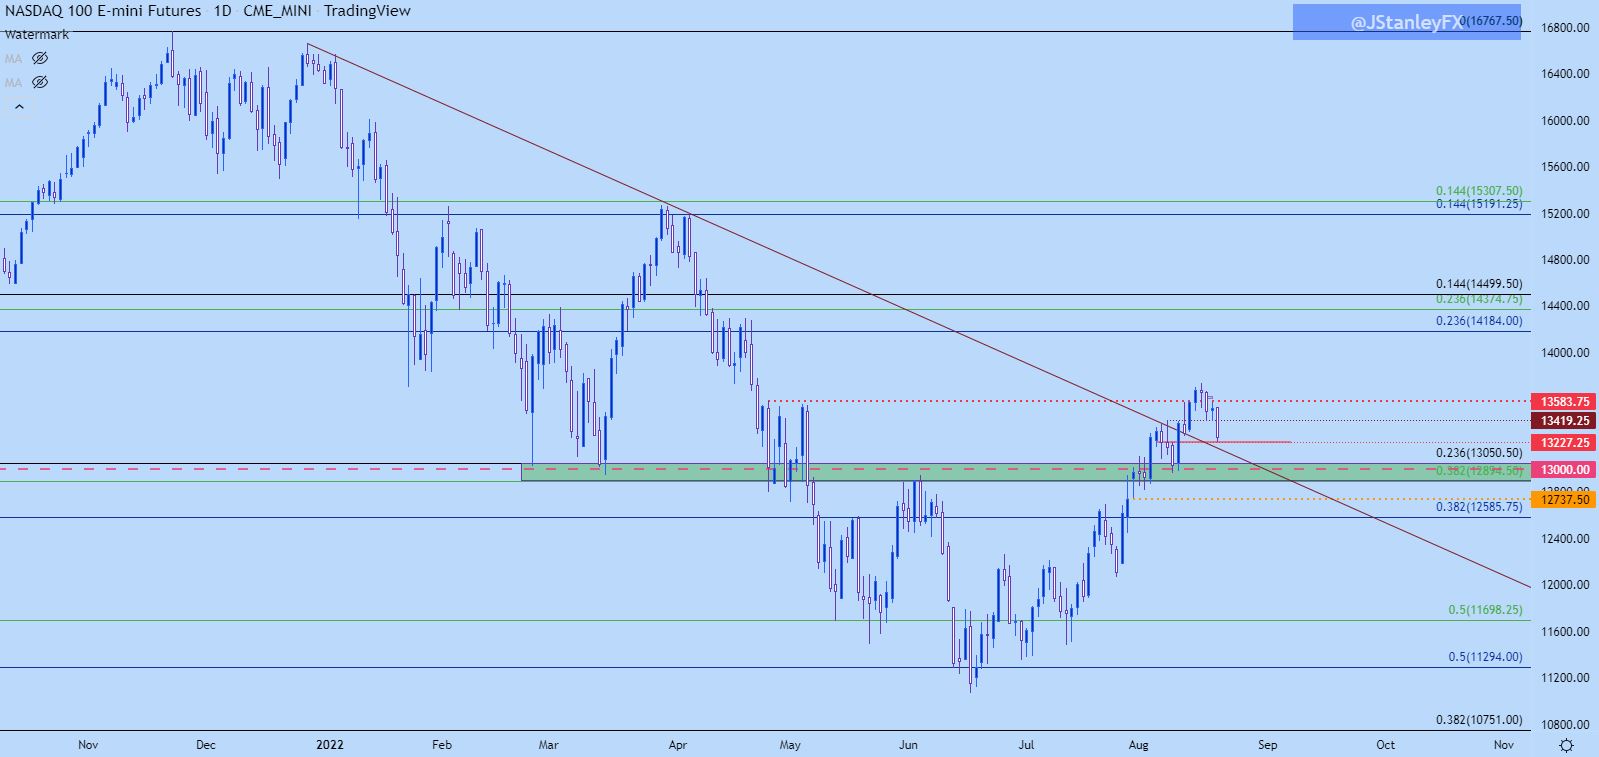
Chart prepared by James Stanley; Nasdaq 100 on Tradingview
Dow Jones
For bearish themes, the Dow looks less clean to me than either of the above two markets. While both the S&P and the Nasdaq put in some bearish action this week, the Dow printed a doji and that was right at a key trendline, taken from swing highs in January and April. And there’s also the 61.8% Fibonacci retracement of the 2022 sell-off that came into the picture.
So, there could be a backdrop of reversal potential here. But, the only indication of such at this point is resistance coming into play to stall the advance from June lows.
Dow Jones Weekly Chart

Chart prepared by James Stanley; Dow Jones on Tradingview
Dow Jones Shorter-Term
Going down to the daily chart and we can see that continued bullish move. There’s an element of support that was trying to play-in from the bearish trendline projection, and that helped to hold the lows on Wednesday and Thursday’s daily bars with those wicks showing support. But price sank below that line on Friday.
The rise from June lows has been uneven, as indicated by the rising wedge formation. So, this does keep the door open for bearish reversals. What I would want to see here to get more bearish on the matter – would be a break of the 50% mark of the 2022 sell-off. That level is confluent with a batch of swing highs from early-June, so that currently presents higher-low support potential. But – if bulls can’t defend that line-in-the-sand, I think we could be moving back towards a re-test of the zone around 32,400, and if that can’t hold, we could be looking much lower before too long.
Dow Jones Daily Price Chart

Chart prepared by James Stanley; Dow Jones on Tradingview
--- Written by James Stanley, Senior Strategist, DailyFX.com & Head of DailyFX Education
Contact and follow James on Twitter: @JStanleyFX


