


US DOLLAR FORECAST – WEEKLY TECHNICAL OUTLOOK FOR DXY, AUD/USD, USD/CAD, USD/JPY, EUR/USD
- The US Dollar and broader DXY Index could hold a rough trading range until there is a material shift in the US-China trade war narrative as negotiations toward a phase one deal ‘hit a snag’
- AUD/USD, USD/CAD, USD/JPY and EUR/USD price action comes into focus next week in light of the scheduled event risk detailed on the DailyFX Economic Calendar
- Check out the latest US Dollar Price Volatility Report for 1-week options implied trading ranges on major USD currency pairs
Before diving into individual US Dollar currency pairs, we begin our analysis by observing USD price action via the DXY Index. The DYX Index is a popularly referenced benchmark that tracks the Greenback’s performance against a basket of major US Dollar currency pairs. That said, it is beneficial to understand the underlying mechanics of the DXY Index before attempting to decipher where broader US Dollar might head next.
The DXY Index is concentrated heavily toward EUR/USD price action comprising 57.6% of the DXY Index with USD/JPY, GBP/USD, USD/CAD carrying a weight of 13.6%, 11.9% and 9.1% respectively. USD/SEK with a weight of 4.2% and USD/CHF at 3.6% make up the remaining composition.
US DOLLAR INDEX PRICE CHART: WEEKLY TIME FRAME (OCTOBER 17, 2016 TO NOVEMBER 15, 2019)
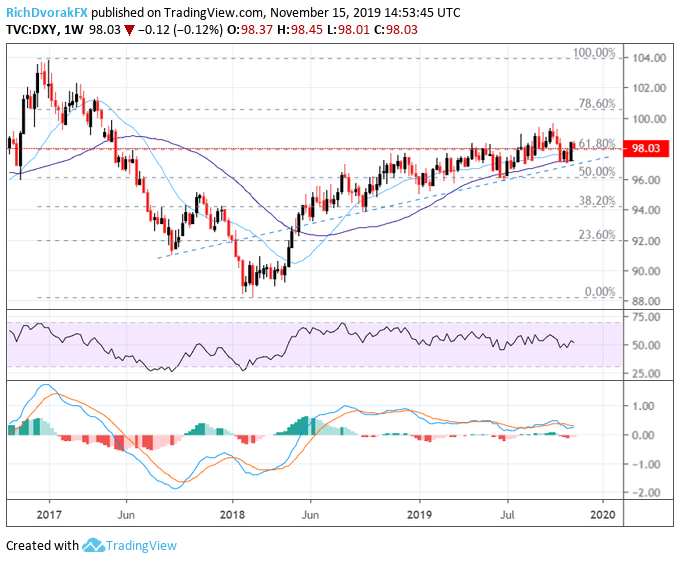
Chart created by @RichDvorakFX with TradingView
Shifting focus back to USD price action we see that the US Dollar Index has, on balance, drifted lower over the last 5 trading days. This follows the prior week’s impressive rebound. Though I noted in the US Dollar Price Volatility Report published last Friday that that while the claw-back attempt by the US Dollar was notable, the Greenback faced an intimidating zone of confluent resistance around the 98.25-98.50 level. Such still seems to be the case.
At the same time, the 97.00 handle will look to continue bolstering the US Dollar, which is highlighted by the 50-week simple moving average and bullish trendline extended through the September 2018 swing low and higher swing low printed this past June. A more immediate area of confluent support near the 98.00 mark is identified by the 61.8% Fibonacci retracement of the US Dollar’s trading range since its January 2017 peak.
Though the recent bounce in the DXY index could also have a fundamental explanation with the US Dollar tracking the fall in Fed rate cut odds as US-China trade war risk seemingly recedes. This may not last long, however, with recent reports crossing the wires that US-China trade talks have hit a snag as the two nations struggle to finalize a partial trade agreement.
AUD/USD PRICE OUTLOOK – NEUTRAL
While not included in the DXY Index, keeping tabs on spot AUD/USD price action will be critical with headlines on US-China trade talksfront and center.
The technical outlook for AUD/USD is neutral with spot prices currently wedged between the Aussie’s broad downtrend against the US Dollar – dating all the way back to July 2011 – and its short-term ascending support line connecting the series of higher lows since early October.
Though recent weakness in spot AUD/USD prices has pushed the currency pair below its 20-week SMA and confluent support highlighted by the 23.6% Fibonacci retracement level of its 2019 trading range.
CHART OF AUD/USD: WEEKLY TIME FRAME (MAY 20, 2018 TO NOVEMBER 15, 2019)
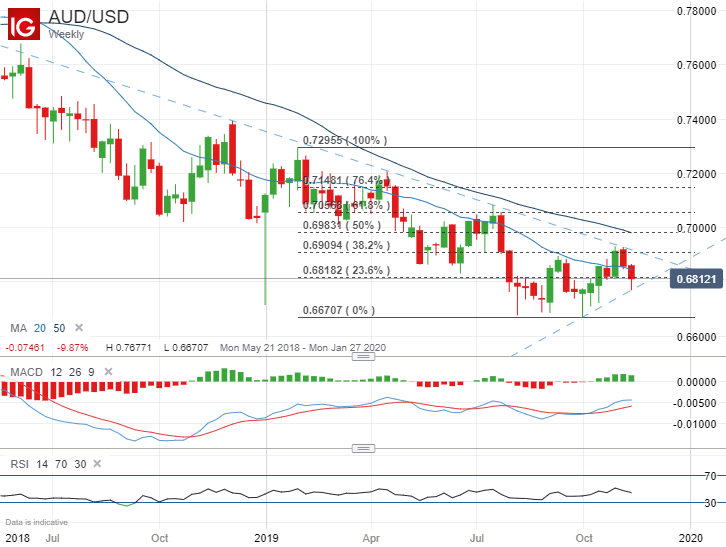
This development could exert downward pressure on the Aussie-Dollar going forward, but the quick rebound back above the 0.6800 handle last week likely provided encouragement to AUD/USD bulls. Alas, AUD/USD may maintain a rough trading range between 0.6800-0.6900 until there is a resolution above or below these critical technical levels.
A breach of the 0.6800 handle again might lead to a retest of last week’s lows, however, and could open up the door for AUD/USD bears to target the 0.6750 level. Conversely, topping the 0.6900 price zone has potential AUD/USD bulls to set their eyes on the 0.7000 mark.
USD/CAD PRICE OUTLOOK – BULLISH
USD/CAD price action will likely linger in forex traders’ crosshairs following the recent release of weak Canadian jobs and housing data and an upcoming speech from BOC Governor Poloz as well as a high-impact Canadian inflation report due next week.
These events could very well determine if the BOC will capitulate and cut rates, which will likely dominate USD/CAD over the near term. Nevertheless, spot USD/CAD prices have notched an impressive rally over the last three weeks and speaks to the US Dollar’s strong underlying tailwind relative to the Loonie.
CHART OF USD/CAD: WEEKLY TIME FRAME (JUNE 17, 2018 TO NOVEMBER 15, 2019)
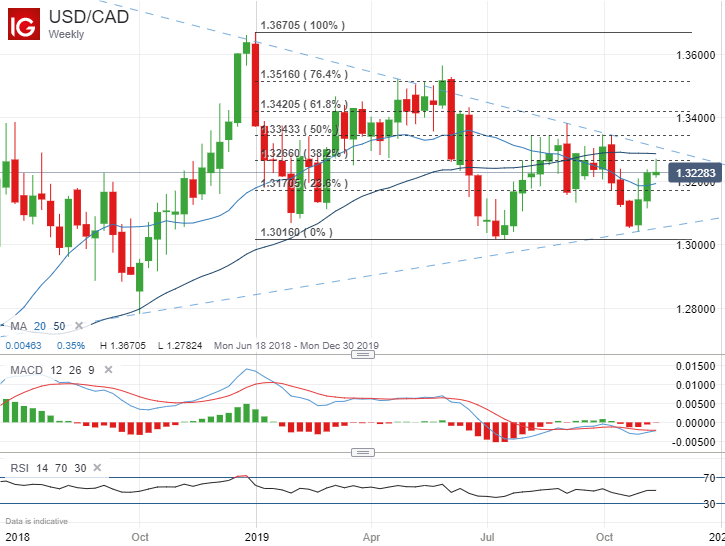
The surge in spot USD/CAD ran into a notable level of technical resistance, however, and is highlighted by the 38.2% Fib of its trading range etched out so far this year. This zone of confluence around 1.3270 is also underpinned by 200-day SMA.
Yet, the could be potential for a retest of this level and 1.3300 handle. This might be facilitated by the 1.3200 level providing a strong degree of buoyancy for the US Dollar while the impending bullish MACD crossover speaks to the possibility of sustained upward momentum.
USD/JPY PRICE OUTLOOK – NEUTRAL
The US Dollar could find technical resolution against its JPY counterpart very soon with this sentiment-geared and interest rate sensitive forex pair (due to its popular use in the currency carry trade) coiled tightly between rising and falling trendlines.
Aside from US-China trade talks, the release of FOMC minutes from the October Fed meeting has potential to provide USD traders with fundamental conviction to test the boundaries of its month-to-date trading range.
Although I noted this past week that the daily USD/JPY chart eyed a looming reversal with a break in bearish rising wedge pattern in focus, the recently developed rising support line on a weekly spot USD/JPY price chart seems to still be intact.
CHART OF USD/JPY: WEEKLY TIME FRAME (MARCH 28, 2018 TO NOVEMBER 15, 2019)
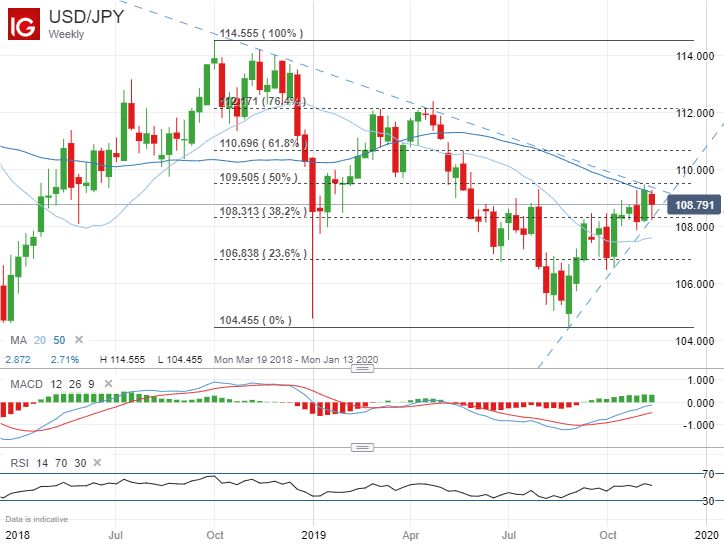
Nevertheless, the 50-week SMA and 109.00-109.50 zone of confluent have potential to thwart a sustained upside attempt.
While the 108.00 handle will likely look to keep spot USD/JPY prices buoyed, a material breakout below the ascending support line extended through the series of higher lows recorded on August 25, October 06 and November 01 could open up the door to test its 20-week SMA.
On that note, a drop in the RSI beneath 50 and toward ‘oversold territory’ could suggest a growing bearish bias.
EUR/USD OUTLOOK – NEUTRAL
Last but not least, EUR/USD outlook this week as spot prices gravitate around the 23.6% Fibonacci retracement of its 2019 trading range, which could keep the world’s most liquid currency pair relatively anchored.
That said, the ECB meeting minutes release from the central bank’s most recent monetary policy update – in addition to a speech from new ECB President Christine Lagarde – could provide sources of volatility for EUR/USD price action next week.
CHART OF EUR/USD: WEEKLY TIME FRAME (MAY 6, 2018 TO NOVEMBER 15, 2019)
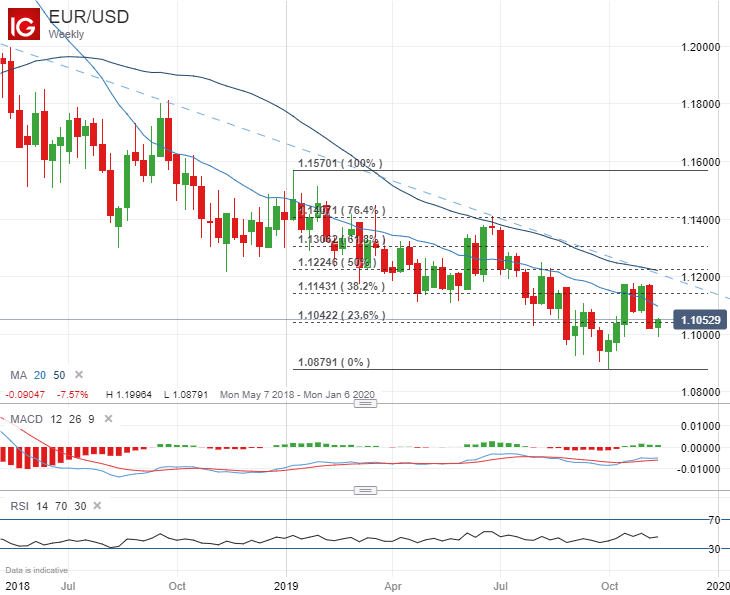
The 1.1000 handle comes into focus as immediate technical support and if this level gives way it could open up the door for EUR/USD bears to target year-to-date lows. Conversely, spot EUR/USD price action could extend last week’s rebound from the preceding week’s steep selloff.
Above the downward sloping 20-week SMA, which could exert downward pressure on EUR/USD going forward, confluent resistance around the 1.1150-1.1175 area is underscored by the 38.2% Fib.
FOREX VOLATILITY & US DOLLAR INDEX PRICE CHART: DAILY TIME FRAME (JUNE 19, 2018 TO NOVEMBER 15, 2019)
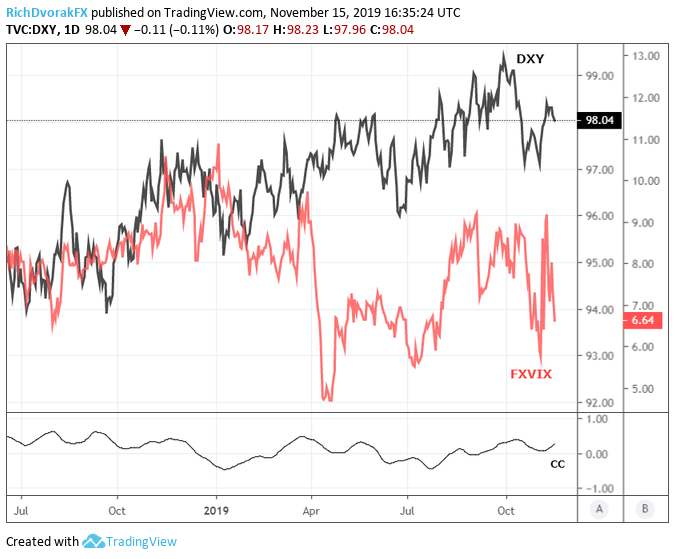
Chart created by @RichDvorakFX with TradingView
I detailed in the most recent USD Price Volatility & Implied Trading Ranges report some of the primary fundamental headwinds faced by the US Dollar – including fading forex volatility. FXIVX, a currency volatility index equally weighted to EUVIX, BPVIX and JYVIX (Cboe’s 30-day implied volatility indices on the Euro, Pound and Yen respectively), reflects the plunge in volatility across the forex market as broader risk appetite runs rampant.
A strengthening correlation between the US Dollar Index and currency volatility – combined with the recent nosedive in FXVIX – suggests pain could be ahead for USD price action. Then again, a sharp uptick in volatility seems overdue amid a rising risk of complacency, which would likely spur demand for the US Dollar in turn if another surge in volatility does in fact unfold.
For comprehensive fundamental and technical insight on the US Dollar, download our free 4Q-2019 Forecasts and Trading Guides.
-- Written by Rich Dvorak, Junior Analyst for DailyFX.com
Connect with @RichDvorakFX on Twitter for real-time market insight


