


Technical Forecast for Dow, S&P 500, FTSE 100, DAX and Nikkei
- S&P 500, Dow and Nasdaq 100 Charts: Monday’s Reversal Lows Hold the Key.
- Volatility Check: A December Crisis or a Reversion to Seasonality?
- Are you looking for longer-term analysis of Equity prices? Check out our Quarterly Forecasts as part of the DailyFX Trading Guides.
US Indices Holding Near Lows Ahead of December FOMC
With now two weeks left until the end of Q4, global stocks have yet to shake off the slump that showed-up in October of this year, and this leads into a key FOMC rate decision on the calendar for next week that will likely help to determine whether or not the ‘Santa Rally’ shows up across US indices. While the bank is widely-expected to hike rates for the fourth time this year, the predominant focus will be on the FOMC’s projections for next year and thereafter; looking for signs of caution as a series of global risks have begun to show across a wide swath of global economies. With evidence of slowing growth in both Europe and China, this puts a number of American companies in a difficult spot, and a more supportive backdrop from the world’s largest Central Bank may be able to help slow the selling. Below, I parse through five of the world’s largest equity indices in the effort of devising strategy for the week ahead.
Dow Jones Re-Approaches 24k Ahead of December FOMC
There isn’t much to be positive about around price action in US equities at the moment, as each recovery since the initial spill to kick off Q4 has fallen flat. In the Dow, this has amounted to a series of lower-highs in each month of the quarter, with the November swing-high falling short of the October level, and the same being seen in early-December. I had looked into the matter yesterday, zeroing in on the 25,000 level for an indication of a return of bullish price action, and this very much remains in-play ahead of next week’s FOMC rate decision. Should the bank echo a more passive, slower ‘wait-and-see’ approach, strength could quickly come back into US stocks; and the Dow remains as one of the more attractive indices for such a theme. While the S&P 500 is testing support below the 78.6% Fibonacci retracement of the 2018 move, the Dow is a bit less bearish by comparison. The forecast will be set to bullish for next week, largely on the basis of the Dow being a touch less bearish than the S&P 500 ahead of a key rate decision.
Technical Forecast for the Dow Jones Industrial Average: Bullish
Dow Jones Daily Price Chart
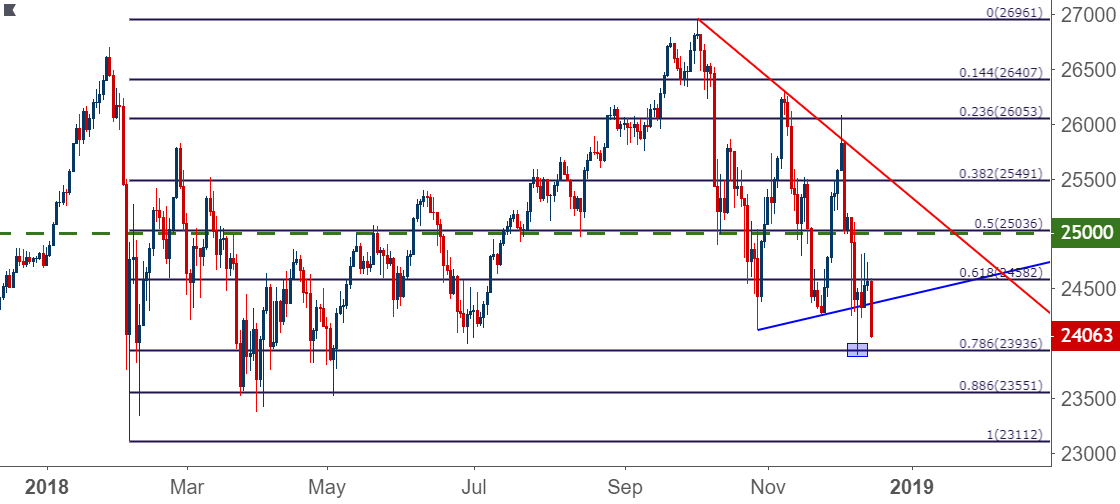
Chart prepared by James Stanley
S&P 500 Tests Below 2600 After Buyers Unable to Hold Support
It’s a very similar backdrop in the S&P 500, with the caveat that bearish price action has been a bit more pronounced in the broad-based index. Similar to the Dow , the opening days of Q4 saw a very visible flip in which a strong and consistent bullish trend turned-around on a dime. That bearish pressure has remained in varying forms ever since, and bulls have yet to be able to turn the tide. A similar argument can be made here as above with the Dow, in which a more passive FOMC can provide a supportive backdrop for a ‘Santa Rally’ to show into the end of the year. But, the Dow has been a bit less bearish by comparison and, as such, bullish plays will be relegated to the blue-chip index. The forecast for the S&P 500 for next week will be set to neutral.
Technical Forecast for the S&P 500: Neutral
S&P 500 Daily Price Chart
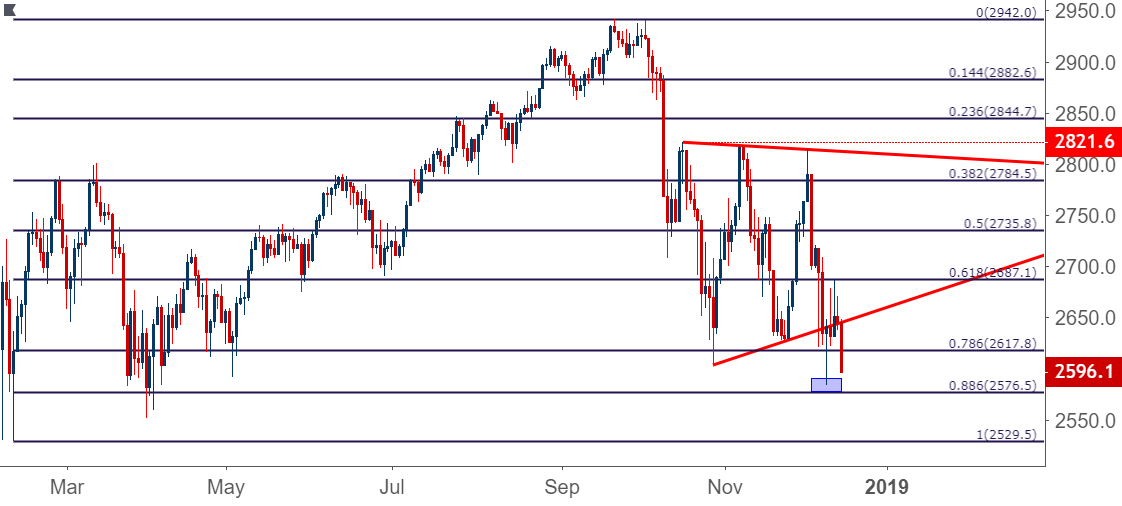
Chart prepared by James Stanley
FTSE 100 Bounces After Fresh Two-Year Lows
The FTSE was finally able to make some ground below the 6850 level that had provided two vigorous support bounces already in 2018; first in March, leading to a 1,000+ point rip, and then again in October for a more-modest 250 point bounce. The third test of that level, however, was unable to contain sellers, and prices soon broke down to fresh two-year lows. But, despite the tumultuous headlines throughout this week, the index has actually gained value. This comes as Theresa May called off the Brexit vote in UK Parliament, and then faced a no-confidence vote. While she survived the vote, matters remain just as messy if not even more opaque, as nobody really knows what Brexit will end up looking like. PM May has the unenviable task of trying to negotiate a deal that will satisfy both Europe and UK Parliament. This seems to be a tall task with low probabilities for success, but even with that backdrop, the FTSE did not extend the earlier-month plunge; and when a market doesn’t sell-off on bad news, something is amiss. The forecast for next week will be set to neutral.
Technical Forecast for the FTSE 100: Neutral
FTSE 100 Weekly Price Chart

Chart prepared by James Stanley
DAX Holds at Two-Year Lows as Bears Remain In-Control
Also coming off of fresh two-year lows is the DAX. This has been my choice of market for trading equity weakness over the past few months, as September brought along some interesting observations on the under-side of price action. While US and Japanese stocks were bursting-higher in the final month of Q3, the DAX was starting to slip below some key levels on the chart. That pain continued in October as global equities started to face pressure, and that theme of weakness in the index has largely remained ever since. Along the way, prices broke-below both a key trend-line that started back in 2011, along with the 50% marker of the 2016-2018 major move. Making matters even more interesting around the DAX would be a resistance test at that 50% level that had helped to provide support in both October and November. The forecast for next week will be set to bearish.
Technical Forecast for the DAX: Bearish
DAX Weekly Price Chart
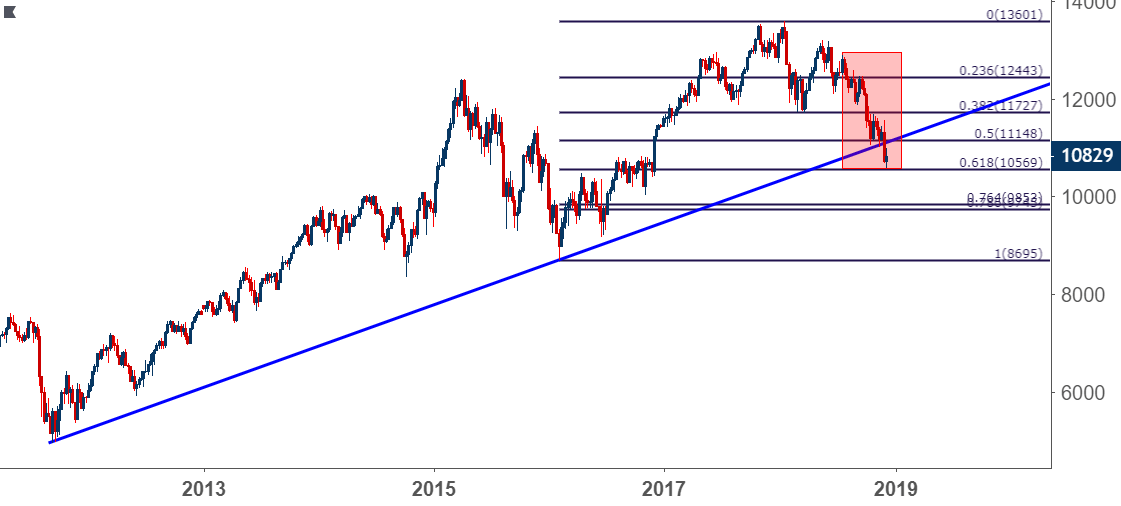
Chart prepared by James Stanley
Nikkei Gives Back Early-Week Gains
The Nikkei was roughly flat on the week despite some decent volatility on either side of the market. The first part of this week started off positively, as a support test on Monday led to strength through Thursday. But Friday saw the entirety of this week’s gains erased as sellers pushed right back to the weekly open, taking place around the 14.4% retracement of the October sell-off. This could open the door for bullish swing-plays, looking to lodge stops below the October swing-low; and next week’s economic calendar brings both a Bank of Japan rate decision to go along with November inflation data. The forecast for the Nikkei will be set to neutral for next week as the prior bullish trend has yet to show much promise ahead of a big week of event risk.
Technical Forecast for the Nikkei: Bullish
Nikkei Daily Price Chart
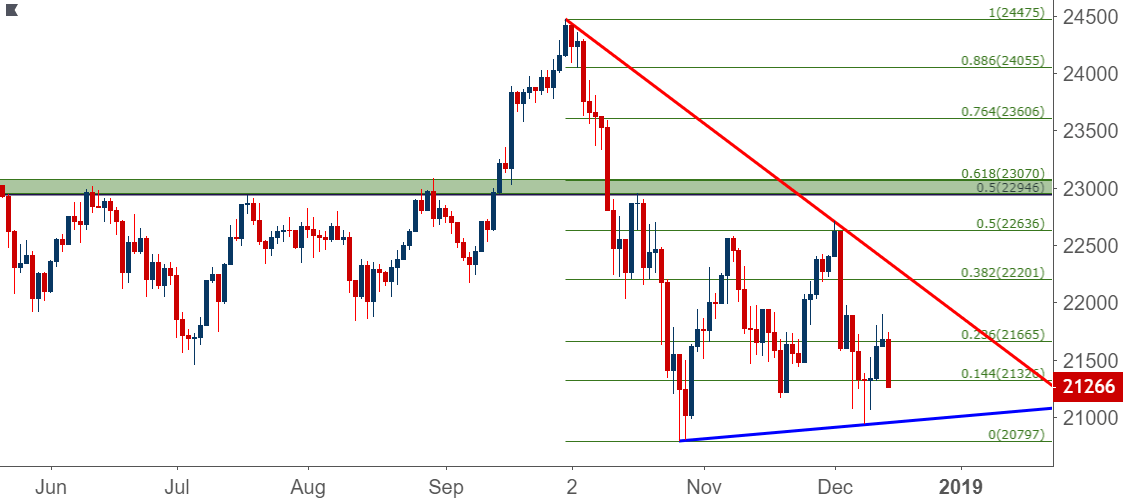
Chart prepared by James Stanley
--- Written by James Stanley, Strategist for DailyFX.com
Contact and follow James on Twitter: @JStanleyFX
Other Weekly Technical Forecast:
Australian Dollar Forecast – AUD Prices May Fall Into 2019, AUD/CAD at Risk to Reversal Pattern
British Pound Forecast – Seven Weekly Bear Candles Dominate
US Dollar Forecast – Dollar Hits an 18-Month High as Anti-Currency Demand Fights Liquidity


