


S&P 500/Nasdaq 100/Dow Jones Technical Highlights:
- S&P 500 key-reversal day came at an important juncture
- Dow Jones head-fake break and reverse helps create a floor
- Nasdaq 100 holding up slightly better, showing some relative strength
Traders are reacting to the uptick to volatility, to see how check out the IG Client Sentiment page.
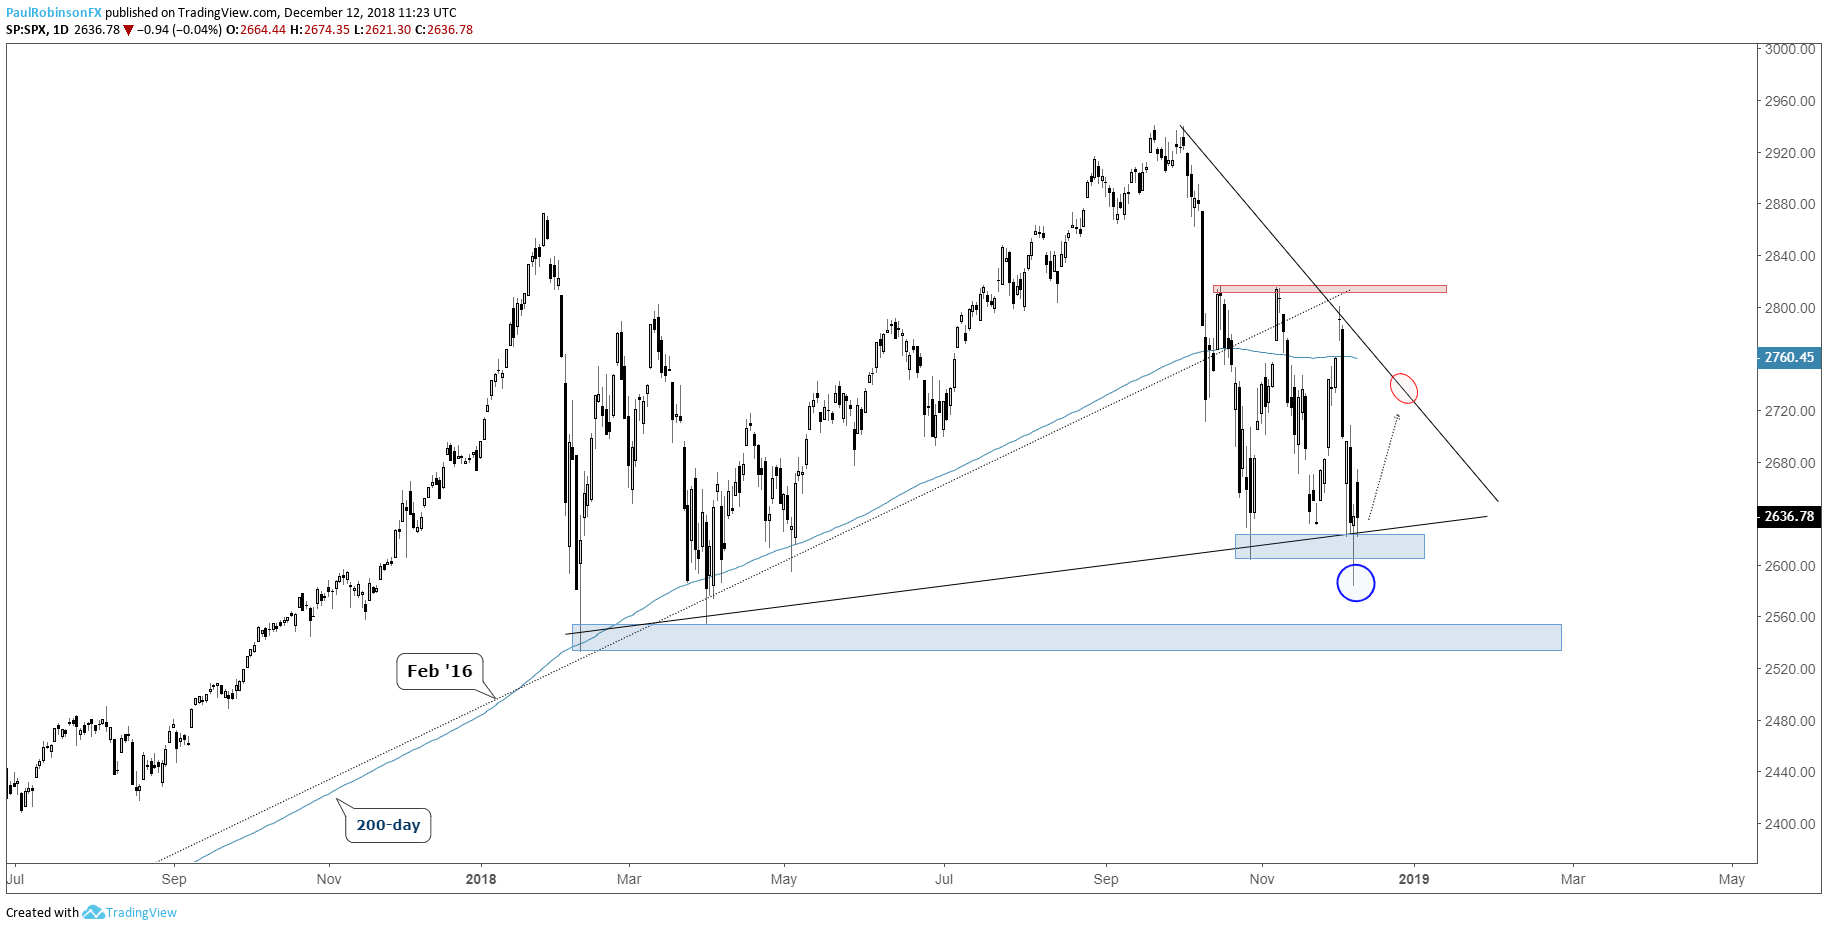
S&P 500 key-reversal day came at an important juncture
On Monday the market was headed for a breakdown below recent support towards the year-lows before reversing sharply to close slightly in the green. The key-reversal was a solid form of rejection and suggests the market may want to trade higher.
A close below support is the key here, and as long as the S&P 500 maintains above the Monday low at 2583 then focus shifts higher. Not looking of a rip-roaring rally, but rather a modest move higher towards the trend-line off the record high, November high at the very highest. The broader bias is still lower, but with the tail-end of the year near that may be staved off until we get into a new year.
S&P 500 Daily Chart (Key-reversal should keep stabilized)
Dow Jones head-fake break and reverse helps create a floor
On Monday, the Dow broke several forms of support from trend-lines starting in February 2016 to February of this year to Oct/Nov lows, but selling was reversed to post a clean key-reversal candle. Yesterday we saw some selling after the gap, but just as long as the Dow doesn’t sink below 23881 we could see a modest lift in the near-term. Resistance clocks in at the 200-day running through just below 25100 and then there is the trend-line off the record high, followed by what is viewed as a best case scenario of reaching the Nov/Dec highs.
Dow Daily Chart (Fake-break and reverse)

Nasdaq 100 holding up slightly better, showing some relative strength
The downside leading Nasdaq 100 has been a small bright spot of late as it didn’t trade to a lower low with the other two major indices, and for the most part held in positive territory Monday while the S&P 500 and Dow were off by a considerable amount. As is the case with the other two indices, the trend-line off the record highs will be in focus as resistance, followed by highs over the past month, the 200-day and underside of the Feb 2016 trend-line. A break below 6442 will bring in further carnage and a test of the year lows but seen as a lower probability event for now.
Nasdaq 100 Daily Chart (Holding above support)

To learn more about U.S. indices, check out “The Difference between Dow, Nasdaq, and S&P 500: Major Facts & Opportunities.” You can join me every Wednesday at 10 GMT for live analysis on equity indices and commodities, and for the remaining roster of live events, check out the webinar calendar.
Tools for Forex & CFD Traders
Whether you are a beginning or experienced trader, DailyFX has several resources available to help you; indicator for tracking trader sentiment, quarterly trading forecasts, analytical and educational webinars held daily, trading guides to help you improve trading performance, and one specifically for those who are new to forex.
---Written by Paul Robinson, Market Analyst
You can follow Paul on Twitter at @PaulRobinsonFX


