


Technical Forecast for S&P 500, Dow, FTSE 100, DAX and Nikkei
- DJIA: Dow Jumps Above 25k as Powell, FOMC Adapt to Global Risks.
- Rumors over US-China Trade War Concentrate Market Focus on G20 Meeting.
- Are you looking for longer-term analysis of Equity prices? Check out our Quarterly Forecasts as part of the DailyFX Trading Guides.
Bulls Come Back to the Bid into US Stocks – But Can it Last?
It was a strong week for US stocks, helping both the Dow and the S&P 500 to finish the month of November with gains. This might be surprising even if we go back just a week, as both the Dow and S&P closed last week’s holiday-shortened outing near the lows, extending a seven-week pattern of pain that began shortly after the Q4 open. But, support held coming into Monday, and a recovery bounce turned into a rather strong jump on Wednesday around a key speech from FOMC Chair, Jerome Powell. That strength held through Thursday and another positive factor appeared to help support the bid on Friday, as rumors began to circulate that US-China relations may be thawing around the trade tariffs theme.
Outside of the US, however, a number of issues remain, as both UK and European equities have risk items of note that have thus far constrained bullish responses. And this weekend brings a large item of potential risk with the G20 meeting in Argentina, and this can carry impact to both US and global equity indices. Below, I parse through five of the world’s largest equity indices in the effort of devising strategy for next week.
Dow Jones Jumps by 4.7% As Powell Softens Speech
Wednesday’s speech from FOMC Chair Jerome Powell brought a bit of calm around a rather worrisome theme. While matters like Brexit, the Italian budget, or even trade wars had little apparent effect on US equities throughout Q3, Chair Powell’s speech on October 3rd seemed to rattle markets. This is when Mr. Powell opined that the FOMC was ‘a long way’ from the neutral rate, which is the theoretical interest rate at which monetary policy is neither stimulative nor restrictive. This implied, or perhaps was just heavily inferred to mean that the bank had quite a few more interest rate hikes ahead as they strove to strike this ‘goldilocks’ level for monetary policy.
Matters weren’t really the same after that, as October saw the Dow Jones Industrial Average fall by -7.17%. That weakness went on hiatus in the first week of November and the Dow recovered by retracing 76.4% of that prior October sell-off. But – the FOMC rate decision on November the 8th brought sellers back into the market, and prices soon pushed right back down to those prior October lows. That theme held into last week’s close until support showed up as we opened into this week.
The item of positivity from this week is taken from the fact that market participants now know that the FOMC is on guard, and this indicates a softer stance on a key item of pressure that really started to take its toll on the risk trade in Q4. The forecast on the Dow for next week will be set to bullish.
Technical Forecast for the Dow Jones: Bullish
Dow Jones Four-Hour Price Chart
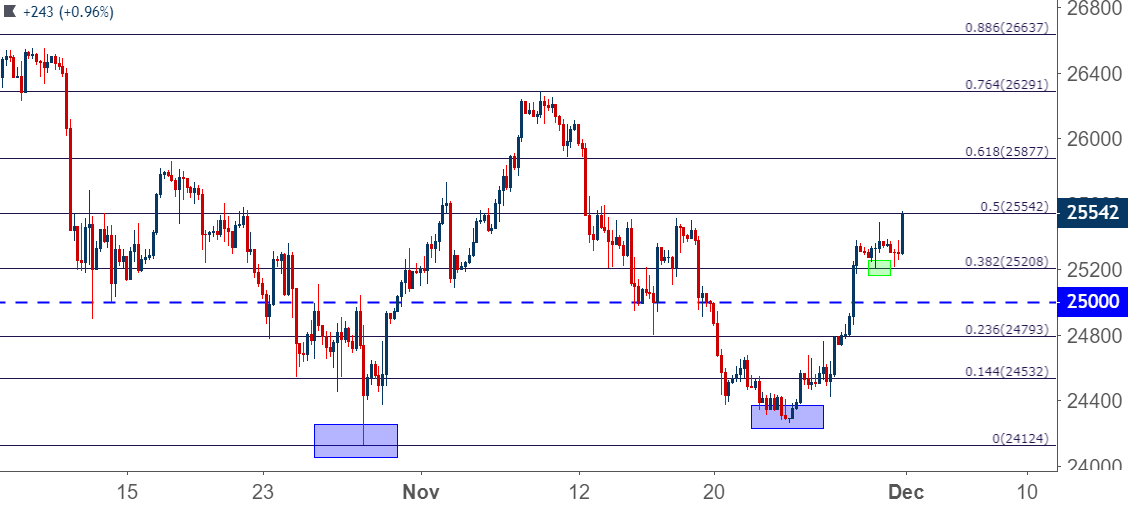
Chart prepared by James Stanley
S&P 500 Back to 2750
A very similar backdrop developed around the S&P 500, as the index closed last week near the lows, found support to open this week and then gained each day, Monday-Friday. The S&P 500’s weekly candle erased the entirety of last week’s losses as the pair vaulted into a key area on the chart at 2750; and this helped to craft fresh two-week highs on the index into month-end.
The S&P 500 could be a bit more difficult to justify for bullish stances at the moment when compared to the Dow, as the Dow had put in a higher-high earlier this month ahead of that FOMC rate decision; while the S&P 500 put in a lower-high that indicates a bit more congestion than what was seen above in the Dow. For next week, the forecast will be set to neutral as the Dow Jones Industrial Average is more attractive for topside plays.
Technical Forecast for the S&P 500: Neutral
S&P 500 Daily Price Chart

Chart prepared by James Stanley
DAX Hangs Near Two-Year Lows, Clings to Trend-Line Support
It’s been a rough outing for the DAX over the past few months, and that may be getting even more challenged after an announcement this week that President Trump may be targeting European autos for future tariffs. While this didn’t bring on an earth-shattering bearish response, it did help to restrain a recovery bounce after prices ran into a big area of long-term support last week. That support comes from a trend-line that starts at the 2011 lows and connects to the 2016 low. This projection came into play on November 20th, and this helped to lead into a mild bounce on Monday until short-term resistance could come into play.
The DAX still trades in a difficult spot on the chart, and this remains as one of the more attractive indices for bearish equity plays. The forecast for the DAX will be set to bearish for next week.
Technical Forecast for the DAX: Bearish
DAX Daily Price Chart
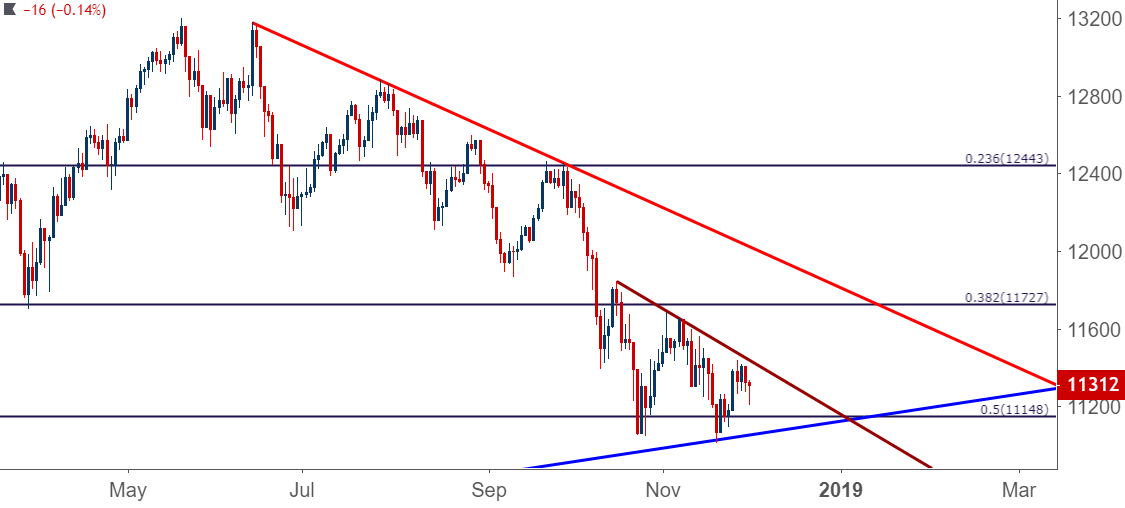
Chart prepared by James Stanley
FTSE 100 Holds Above Long-Term Support
The headlines around Brexit for this month have been troublesome for traders; but in UK stocks, matters don’t look as bad. Prices continue to hold above the 6850 level that’s come into play twice already this year, and this week saw the index squeak out a gain of .76%.
This leaves the FTSE 100 in a rather difficult spot for both bullish and bearish approaches. On the long side of the index, resistance continues to hold around the 76.4 and 78.6% Fibonacci retracements of the 2018 major move. On the short-side of the index, prices have shown little willingness to trade through the 6850 level, and over the past two weeks, a series of higher-lows have developed after another failed attempt to take this price out. The forecast for next week will be set to neutral.
Technical Forecast for the FTSE 100: Neutral
FTSE 100 Daily Price Chart

Chart prepared by James Stanley
Nikkei Reclaims 38.2% Retracement of October Sell-Off
It was a strong week for Japanese stocks as buyers rushed back to the bid, and prices in the Nikkei were up by 4.2% for this week. This comes on the heels of an October that saw a loss of almost -10%, and that followed fresh 27-year highs that were set just a month earlier.
In the latter portion of this week, the Nikkei showed a healthy response at support as taken from the 38.2% retracement of that October sell-off. This is confluent with a trend-line projection that can be found by connecting the mid-October and early-November swing-highs in the index, and this can keep the door open for further upside. The forecast for the Nikkei will be set to bullish for next week.
Technical Forecast for the Nikkei: Bullish
Nikkei Eight-Hour Price Chart
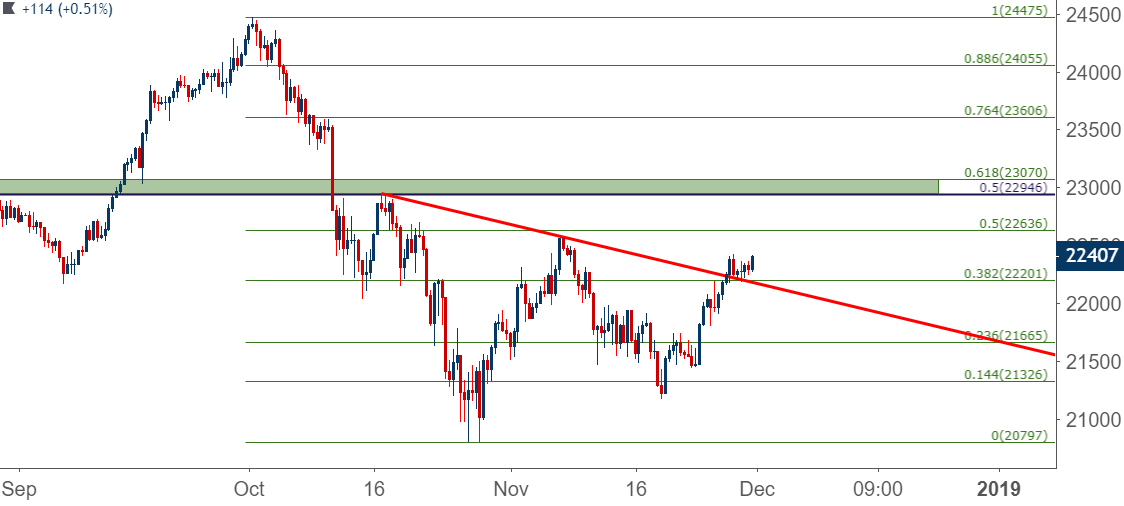
Chart prepared by James Stanley
To read more:
Are you looking for longer-term analysis on the U.S. Dollar? Our DailyFX Forecasts for Q3 have a section for each major currency, and we also offer a plethora of resources on USD-pairs such as EUR/USD, GBP/USD, USD/JPY, AUD/USD. Traders can also stay up with near-term positioning via our IG Client Sentiment Indicator.
Forex Trading Resources
DailyFX offers a plethora of tools, indicators and resources to help traders. For those looking for trading ideas, our IG Client Sentiment shows the positioning of retail traders with actual live trades and positions. Our trading guides bring our DailyFX Quarterly Forecasts and our Top Trading Opportunities; and our real-time news feed has intra-day interactions from the DailyFX team. And if you’re looking for real-time analysis, our DailyFX Webinars offer numerous sessions each week in which you can see how and why we’re looking at what we’re looking at.
If you’re looking for educational information, our New to FX guide is there to help new(er) traders while our Traits of Successful Traders research is built to help sharpen the skill set by focusing on risk and trade management.
--- Written by James Stanley, Strategist for DailyFX.com
Contact and follow James on Twitter: @JStanleyFX
Other Weekly Technical Forecast:
Australian Dollar Forecast: AUD/USD, AUD/JPY May Fall as EUR/AUD Gains
British Pound Forecast: Weekly-Technical-Outlook-Sterling-Probes-New-Lows
Canadian Dollar Forecast: Price Action Muted for USDCAD Until Next Decisive Move
US Dollar Forecast: Dollar Feigns Confidence but Depends on Liquidity to Save Its Bull Trend


