


GOLD FORECAST: SPOT GOLD PRICES (XAU) BOLSTERED BY RISING VOLATILITY AS CORONAVIRUS OUTBREAK PROMPTS RISK-AVERSION
- Gold price outlook grows rosier as the latest coronavirus outbreak in Wuhan, China roils stock market investor sentiment owing to its potential adverse impact on GDP growth
- The price of gold has potential to extend its ongoing ascent as bullion becomes buoyed by spiking volatility and deteriorating risk appetite
- Spot gold (XAU) could also churn higher in response to falling interest rates and re-flattening of the US Treasury yield curve if high-impact economic data next week disappoints
Gold price action has climbed roughly 3.5% so far this year with the precious metal now trading back above the $1,580 mark. Spot gold prices most recently caught bid following the market’s knee-jerk reaction to news that a freshly discovered coronavirus (called 2019-nCoV) has begun to plague China – the world’s most populous country.
The latest coronavirus outbreak has sparked a selloff in risk assets – and corresponding demand for gold in light of its safe-haven characteristics – due largely to the major threat the deadly respiratory infection poses to global GDP growth and investor sentiment.
As of this morning, the new coronavirus has infected more than 3,000 people and taken over 80 lives across the globe since the first case was reported in Wuhan, China last week. Markets are fretting the fact that the ongoing coronavirus pandemic is threatening the Asian nation’s expected economic recovery stemming from its recently down-throttled trade war with the United States.
CHART OF SPOT GOLD (XAU) & GOLD VOLATILITY (GVZ): DAILY TIME FRAME (MAY 2019 TO JANUARY 2020)
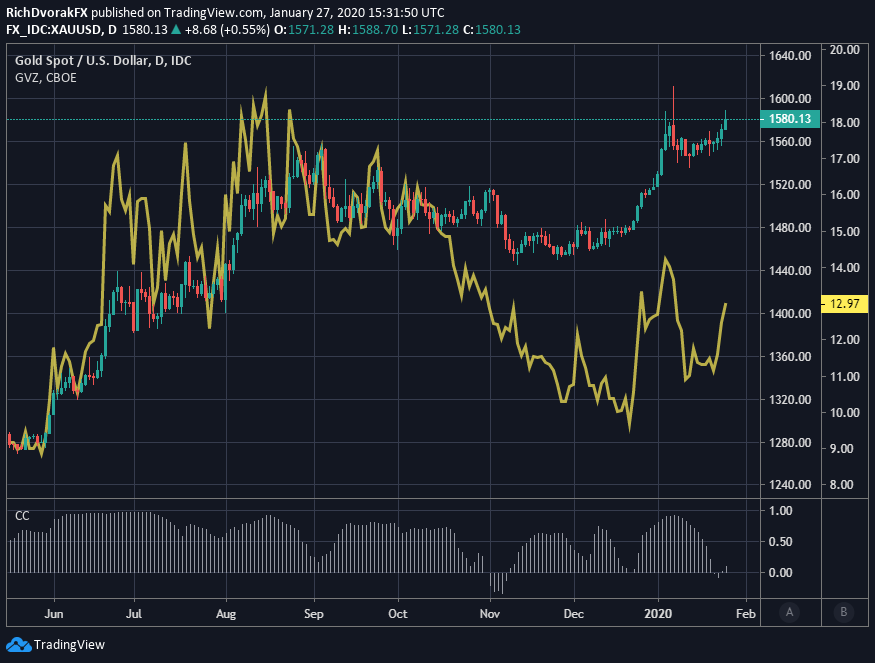
Chart created by @RichDvorakFX with TradingView
Moreover, coronavirus fears are propelling volatility and gold prices higher seeing that the brewing global health crisis has occurred in the midst of the Chinese Lunar New Year. According to the Chinese state transportation ministry, railway traffic is in a free fall with the latest figures down 40% compared to last year’s numbers as travel - and consumer spending - comes to a screeching halt.

The situation and subsequent economic impact could worsen if transmission and mortality rate of 2019-nCoV accelerates, which would likely be met by another extension higher in spot gold prices. That said, the recent XAU/USD rally remains precarious. Gold prices could pivot back lower if market panic surrounding the coronavirus outbreak proves to be an overreaction.
The precious metal may also come under pressure if heavy-hitting economic data releases due this week – such as the Conference Board’s monthly Consumer Confidence Index or the advanced 4Q-2019 US GDP report – top consensus estimates and provide traders with reason to sell anti-risk assets like gold.
CHART OF SPOT GOLD (XAU) & INVERTED US TREASURY YIELD CURVE (10-YEAR LESS 3-MONTH): WEEKLY TIME FRAME (OCTOBER 2015 TO JANUARY 2020)
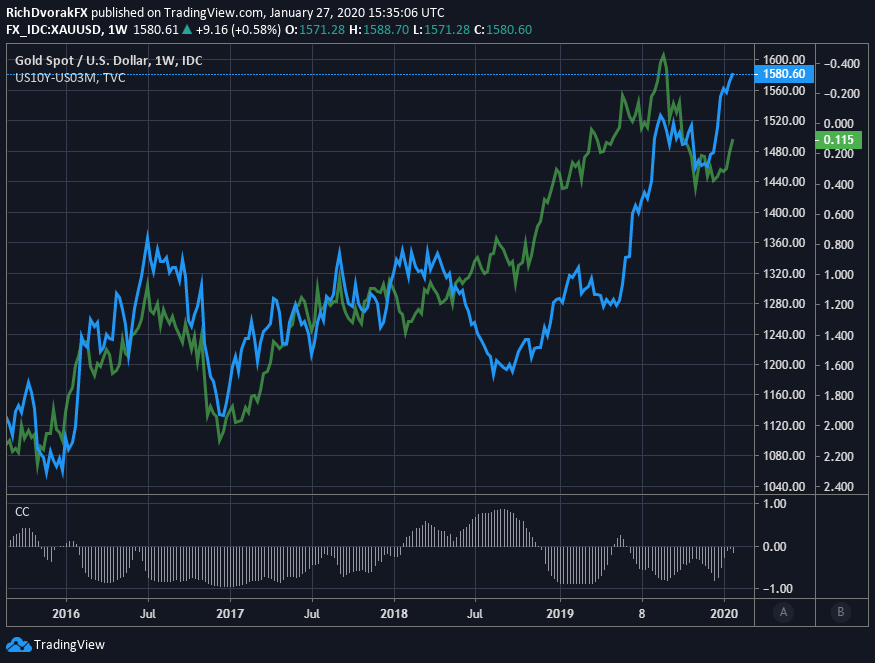
Chart created by @RichDvorakFX with TradingView
While equity traders tend to cite the VIX Index when quantifying perceived risk or uncertainty, which is closely correlated with the GVZ Index and spot gold, economists and the bond market frequently reference the US Treasury yield curve.
Judging by the falling interest rate differential between the US 10-year Treasury note and 3-month Treasury bill, which has dropped to its lowest spread since mid-October and rests roughly 10-basis points away from inverting (i.e. turning negative) again, the bond market seems skeptical of the stock market’s expected rebound in economic activity.
Considering the general indirect relationship between XAU/USD and the US Treasury yield curve illustrated in the chart above, sustained downward pressure on long-term interest rates and re-flattening of the yield curve stands to keep providing a positive tailwind to spot gold prices.
| Change in | Longs | Shorts | OI |
| Daily | 1% | -3% | -1% |
| Weekly | 2% | -8% | -2% |
Furthermore, the Federal Reserve is on tap to release its latest interest rate decision on Wednesday, January 29 at 19:00 GMT. Seeing that the FOMC is widely expected to leave its benchmark interest rate unchanged at the current target range of 1.50-1.75%, market participants will likely focus their attention toward the press conference held by Fed Chair Jerome Powell shortly after the Fed meeting press statement crosses the wires.
Powell will likely portray cautious optimism with regard to the US economy as the head central banker emphasizes a solid jobs market and overall healthy consumer. In turn, this may steer traders away from safe-haven assets such as gold in lieu of relatively riskier investments like stocks in the Dow Jones Industrial Average (DJIA).

Nevertheless, more credence could be placed on FOMC member deliberations over their response to sustained US Dollar funding pressure. The FOMC has pumped well over $400 billion of liquidity into the financial system via overnight repo and term repo operations since September.
On that note, the New York Fed – the district bank largely responsible for implementing Fed monetary policy – recently announced that it will keep its printing press greased up through February 13. Also, according to the December 2019 FOMC minutes, there is notable potential that regular repo operations will be needed “at least through April, when tax payments will sharply reduce reserve levels.”
While this theme has fostered a bearish fundamental headwind for the US Dollar, the surge in liquidity from the Fed has likely helped keep the price of gold bolstered. As such, gold prices could keep climbing higher if the January 2020 Fed meeting reveals that the US central bank intends on providing a standing (i.e. permanent) repo facility or expanding the universe of securities purchased by the FOMC for reserve management purposes.
-- Written by Rich Dvorak, Junior Analyst for DailyFX.com
Connect with @RichDvorakFX on Twitter for real-time market insigh


