US Yield Curve Inversion Talking Points:
- More volatlity in global financial markets has traders looking for a culprit. The bond market may be guilty.
- Certain measures of the US Treasury yield curve have started to invert, sparking fears that the US economy is heading towards a recession within the next year.
- The 2s10s inversion is 'late to the game' - the more important 3m5s and 3m10s curves have been inverted for several weeks.
See the DailyFX Economic Calendar and see what live coverage for key event risk impacting FX markets is scheduled for next week on the DailyFX Webinar Calendar.
Once again,US equity markets have been struggling the past few days, with a variety of reasons being offered up: Brexit; the US-China trade war; and the Federal Reserve’s rate hike path, among others.
But a new catalysts is in the conversation, or at least once that is returning to it after a few weeks of absence: the inversion of the US Treasury yield curve. While the US Treasury 3m5s and 3m10s curves have been inverted for some time, the 2s10s has not; that is, until today.
Read more: US Recession Watch, August 2019 - Dark Clouds Gather Over US Economy
Why Do Investors Look at the Yield Curve?
The yield curve, if it’s based on AA-rated corporate bonds, German Bunds, or US Treasuries, is a reflection of the relationship between risk and time for debt at various maturities. A “normal” yield curve is one in which shorter-term debt instruments have a lower yield than longer-term debt instruments. Why? Put simply, it’s more difficult to predict events the further out into the future you go; investors need to be compenstated for this additional risk with higher yields. This relationship produces a positive sloping yield curve.
When looking at a government bond yield curve (like Bunds or Treasuries), various assessments about the state of the economy can be made at any point in time. Are short-end rates rising rapidly? This could mean that the Fed is signaling a rate hike is coming soon. Or, that there are funding concerns for the federal government. Have long-end rates dropped sharply? This could mean that growth expectations are falling. Or, it could mean that sovereign credit risk is receding. Context obviously matters.
Does the US Treasury Yield Curve Inversion Matter?
The “flattening” of the yield curve has transpired over the past year, predating this week’s inversion in the 2s10s. The knee-jerk reaction by many market participants, but mainly financial news media, has been to declare the inversion of the US Treasury yield curve as a harbinger of a forthcoming recession. The stats speak for themselves: yield curve inversions predict recessions (more on this shortly).
Let’s Ask the Professor
Amid all of the talk about the US Treasury yield curve inverting this week, the Duke University finance professor who is the godfather of yield curve analysis (his 1986 dissertation explored the concept of using the yield curve to forecast recessions) gave an interview to NPR (which can be listened to here). Professor Campbell Harvey made a few key points regarding the yield curve inversion which traders should take to heart:
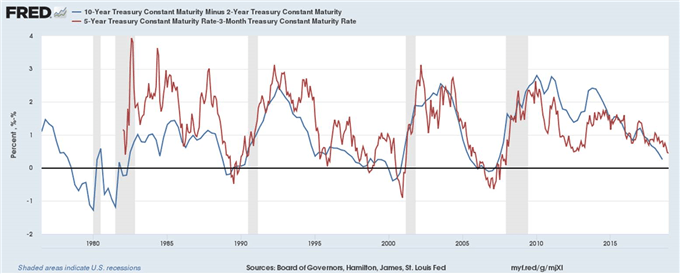
1) The model Harvey used initially looked at the 3-month, 5-year spread (3m5s), and conventional wisdom points to the 2-year, 10-year (2s10s) spread as the yield curve.
US Treasury Yield Curves: 3m5s and 2s10 (1975 to 2018) (Chart 1)

2) The yield curve inversions being discussed now are not significant. According to his research, the yield curve needs to invert in the 3m10s for at least one full quarter (or three months) in order to give a true predictive signal (since the 1960s, a full quarter of inversion has predicted every recession correctly).
For traders, while the 2s10s yield curve inversion makes for splashy headlines, the fact of the matter is, that US recession risks have been rising for some time.
--- Written by Christopher Vecchio, CFA, Senior Currency Strategist
To contact Christopher Vecchio, e-mail cvecchio@dailyfx.com
Follow him on Twitter at @CVecchioFX
View our long-term forecasts with the DailyFX Trading Guides


