


EURUSD, USDCAD, AUDUSD, USDJPY Talking Points:
- The US Dollar put in a week of recovery following the prior-week sell-off, with a big area of confluent support helping to hold the lows.
- Next week will see the US Dollar remain on center-stage for what’s anticipated to be a widely-watched FOMC rate decision. Will the Fed’s dot plot matrix meet the market’s demands for future rate cuts? Below I look at two setups on either side of this theme.
US Dollar Recovers from Confluent Support Ahead of FOMC
The US Dollar put in another interesting week but in stark contrast to the first week of June, prices rallied for much of the period. While the prior sell-off was being driven by lower rate expectations around the Federal Reserve, a re-ascension towards the highs in US equities combined with some not-that-bad inflation data and a strong retail sales report brings that theme into question. And while next week may not bring that move out of the Fed that’s been getting priced-in, the big question is whether the bank’s forecasts will show the three full rate cuts by the end of 2019 that markets have begun to price-in.
Last Friday saw the Dollar plummet to a key area on the chart after the release of Non-Farm Payrolls. The price of 96.47 is a Fibonacci level, and this was confluent with the 200-day moving average. That support has since held the lows, and this week saw buyers come back, particularly on Friday on the heels of a better-than-expected retail sales report. This sets the stage for what’s expected to be a very interesting week on the economic calendar with the Federal Reserve set to announce their June rate decision on Wednesday.
US Dollar Daily Price Chart
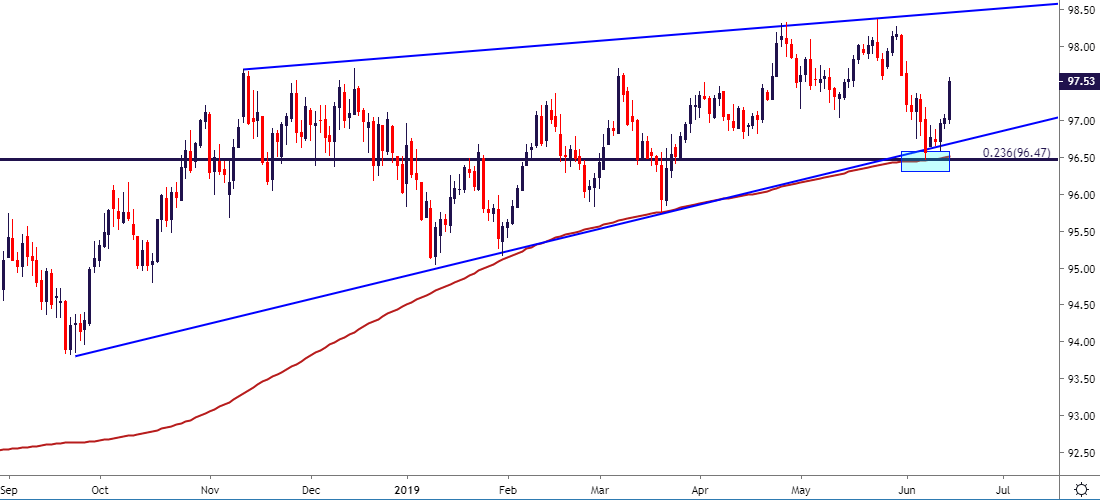
Chart prepared by James Stanley
EURUSD: Welcome Back, 1.1212
Perhaps most noticeable around the US Dollar’s sell-off last week was strength in EURUSD. Other major pairs remained more subdued, such as GBPUSD or AUDUSD, which had actually already started to turn-lower. But in EURUSD, as the Dollar pushed-lower buyers bid the pair up to fresh two-month-highs. And while this move may have been sourced from more of a short-squeeze than a legitimate ramp of positive enthusiasm, the case remains that the topside of EURUSD may be attractive should USD-bears continue to push.
For this week, I wanted to see a pullback to the support zone that runs from 1.1248-1.1265. Friday saw prices cut right through that zone without much of a show from buyers, and a deeper zone soon came into play. This is an area on the chart that I’ve been looking at in these pieces for almost eight months now; coming back into play last November as the sell-off in the pair found support. For next week, a hold above the 1.1187 Fibonacci level keeps the door open for topside strategies, targeting an initial move towards 1.1248-1.1265, after which secondary targets could be addressed around the 1.1325 level that functioned as the April swing-high. Beyond that, resistance from the longer-term range comes into play in the region that runs from 1.1448-1.1500.
EURUSD Daily Price Chart
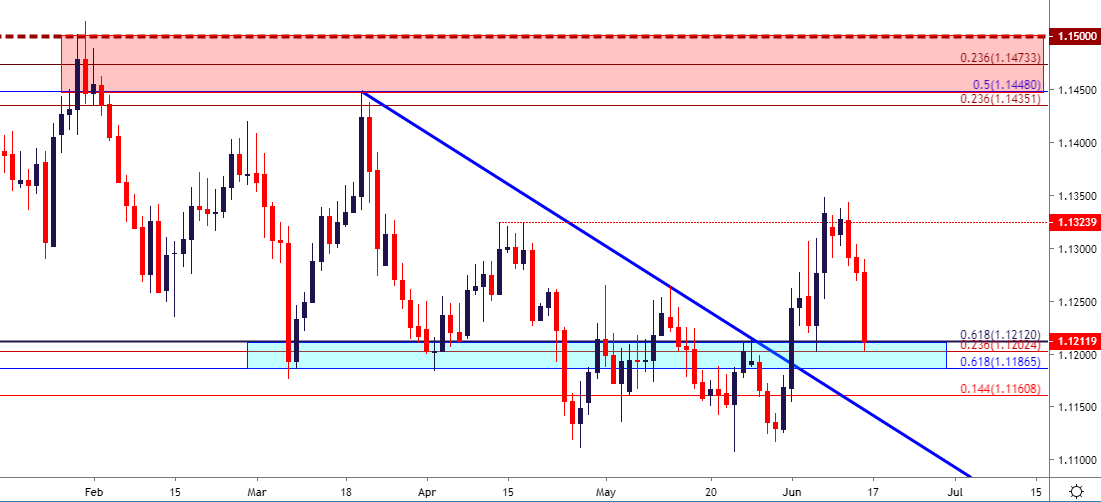
Chart prepared by James Stanley
USDCAD Bounces From Two-Month Lows, Can Bulls Continue to Push?
Last week I had looked at the long side of USDCAD, largely basing the setup off of a hold of two-month-lows around the 1.3250 psychological level. And after a bit of grind to start the week, the pair perked-up, gaining approximately 175 pips and running into a Fibonacci level at 1.3423. This move helped to invalidate potential short-side themes, and with prices working back into the prior range, there may be more room to go, particularly if USD-strength comes back as a dominant theme next week.
USDCAD Eight-Hour Price Chart
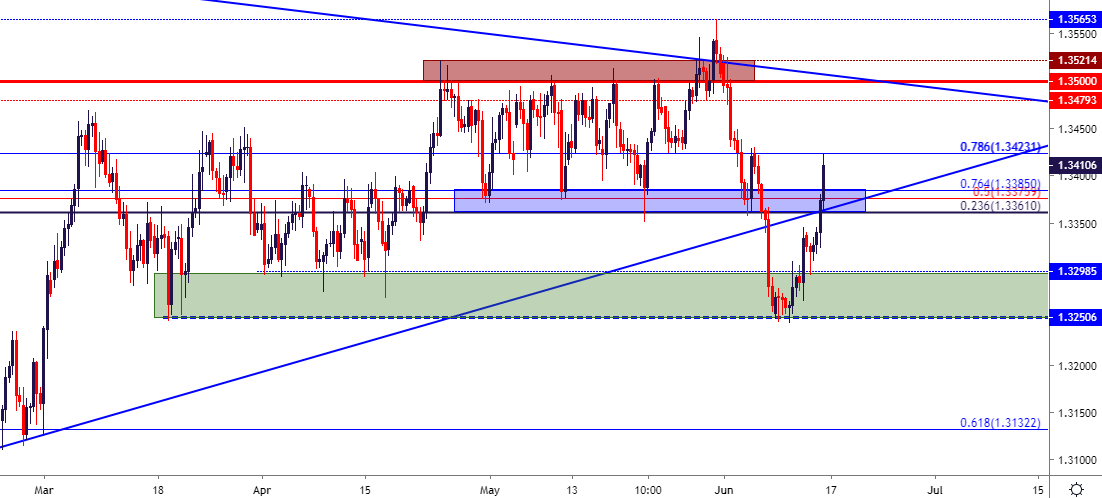
Chart prepared by James Stanley
I had looked into USDCAD again earlier this morning, attempting to use a prior zone of support as fresh resistance for lower-high potential. That did not come into play, as buyers just continued to push beyond that area on the chart, eventually finding a bit of resistance at the 1.3423 Fibonacci level. The pace with which those gains priced-in, combined with the area on the chart in which they showed up makes the bearish case less attractive and, instead, can keep the door open for topside approaches in the pair.
For next week, a pullback to support in the zone that runs from 1.3361-1.3385 can keep the door open for bulls. Topside target potential exists at current resistance around 1.3423, followed by the 1.3475 area after which ‘big picture’ resistance comes into play around 1.3525.
USDCAD Four-Hour Price Chart
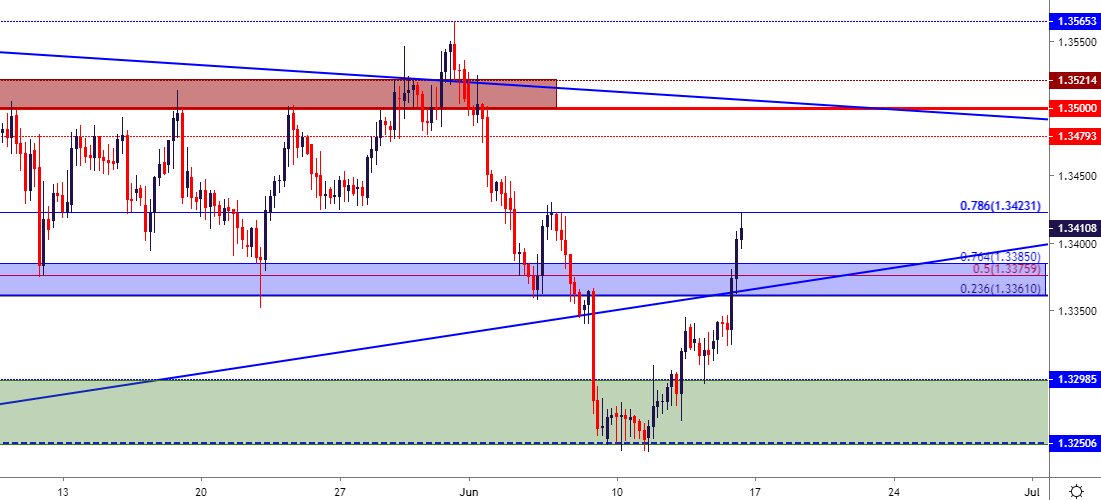
Chart prepared by James Stanley
AUDUSD Down to Fresh Five-Month-Lows
I had looked at bearish setups in AUDUSD last week in the effort of getting some long-USD exposure on the radar. The pair has since pushed down to fresh five-month-lows, and this can keep the door open for more. The primary challenge at the moment is chasing what may be an oversold move, so rather than selling and hoping, a pullback to resistance at prior support may be a more prudent manner of approach. For such a theme there are a couple of nearby areas of interest. The prior zone of support that ran from .6900-.6911 appears especially interesting as this showed a couple of different doses of support but, as yet, hasn’t functioned as resistance. Beyond that, the .6955-.6960 area could be another potential point of resistance should sellers take a step back.
AUDUSD Four-Hour Price Chart
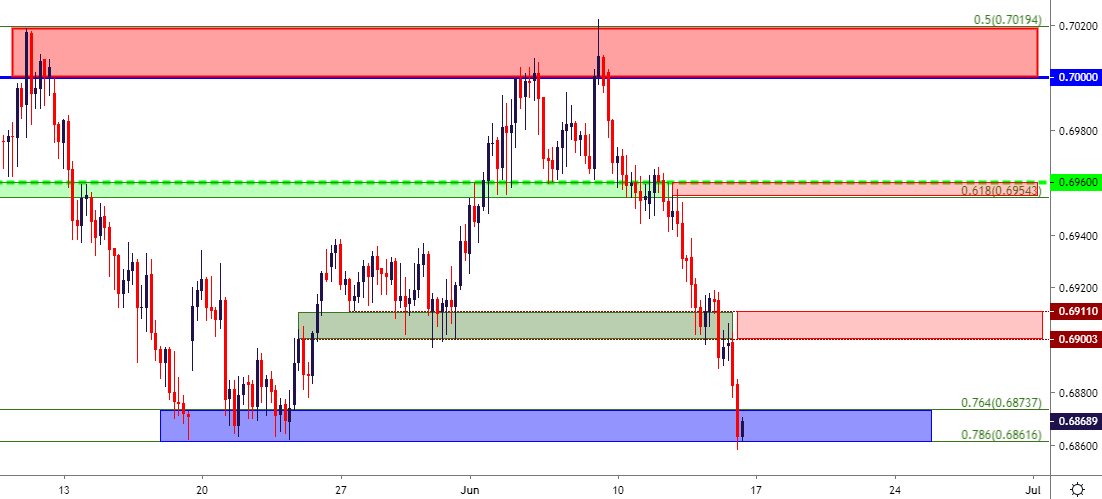
Chart prepared by James Stanley
USDJPY Holds Key Resistance Even as Risk Aversion Remains at Bay
Also on the short-side of the US Dollar is a potential setup in USDJPY. I had looked at this one last week with a focus on resistance potential around 108.70. And while that price helped to hold the highs, sellers weren’t able to make much of a mark and price action has trickled-back into this zone. If risk aversion themes do come back, which is certainly a possibility considering next week’s calendar – the short-side of USDJPY can remain of interest down to the 107.00 area. For next week, a hold below this 109.00 level keeps the door open for short-side strategies. Of note, a Bank of Japan rate decision is also on the docket for next week, so both sides of this pair’s respective economies will be in the spotlight and this can keep USDJPY price action on the move.
USDJPY Eight-Hour Price Chart
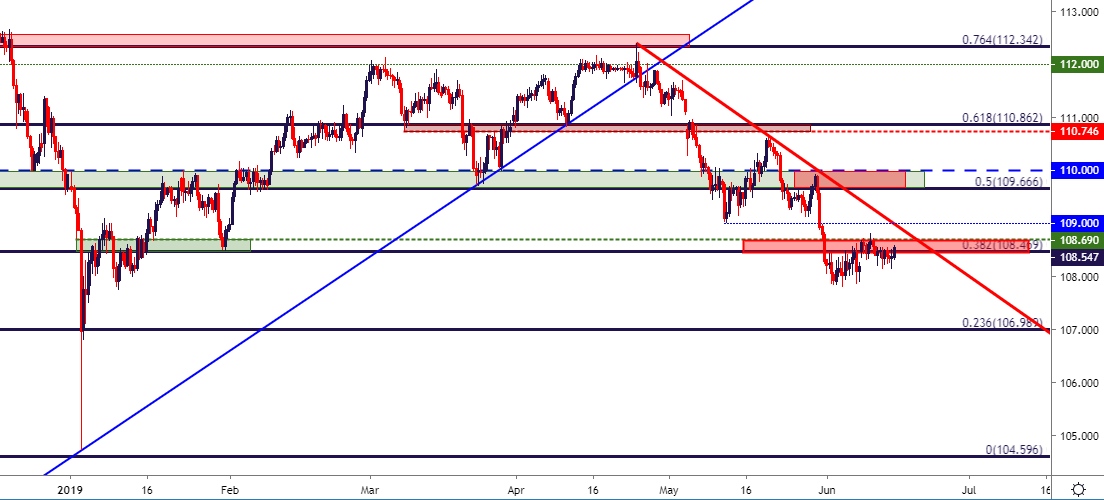
Chart prepared by James Stanley
To read more:
Are you looking for longer-term analysis on the U.S. Dollar? Our DailyFX Forecasts have a section for each major currency, and we also offer a plethora of resources on Gold or USD-pairs such as EUR/USD, GBP/USD, USD/JPY, AUD/USD. Traders can also stay up with near-term positioning via our IG Client Sentiment Indicator.
Forex Trading Resources
DailyFX offers an abundance of tools, indicators and resources to help traders. For those looking for trading ideas, our IG Client Sentiment shows the positioning of retail traders with actual live trades and positions. Our trading guides bring our DailyFX Quarterly Forecasts and our Top Trading Opportunities; and our real-time news feed has intra-day interactions from the DailyFX team. And if you’re looking for real-time analysis, our DailyFX Webinars offer numerous sessions each week in which you can see how and why we’re looking at what we’re looking at.
If you’re looking for educational information, our New to FX guide is there to help new(er) traders while our Traits of Successful Traders research is built to help sharpen the skill set by focusing on risk and trade management.
--- Written by James Stanley, Strategist for DailyFX.com
Contact and follow James on Twitter: @JStanleyFX


