


US Dollar Price Outlook Talking Points:
- The US Dollar is coming out of a brutal week in which sellers maintained control for much of the period. Price action found support at a key Fibonacci level around 96.47, which coincides with the 200 Day Moving Average. But can buyers re-grab control of the matter or is this a mere pause point in a bigger-picture sell-off?
- As looked at in FX Price Action Setups for this week, there are setups on either side of the matter and arguments to seemingly support either scenario. Below, I look at an extension of reversal potential around EURUSD while focusing on longer-term bearish continuation themes in AUDUSD after a big zone of resistance came into play.
- DailyFX Forecasts are published on a variety of currencies such as Gold, the US Dollar or the Euro and are available from the DailyFX Trading Guides page. If you’re looking to improve your trading approach, check out Traits of Successful Traders. And if you’re looking for an introductory primer to the Forex market, check out our New to FX Guide.
US Dollar Change-of-Pace
Last week was a brutal showing for the US Dollar as dovish comments from FOMC Chair Jerome Powell led into a disappointing NFP report that was released on Friday. This extended a bearish move that began on the Friday prior, just after the US Dollar was making a move towards a re-test of the two-year-high. Price action in USD sank all the way down to a trend-line that’s helped to hold support since last September. Sellers continued to push all the way until the 96.47 Fibonacci level came into play, which is the 23.6% Fibonacci retracement of the 2011-2017 major move in the US Dollar.
That price helped to hold the Friday low, and after a small gap-higher to start this week’s trade, price action has continued to claw back a portion of last week’s losses.
US Dollar Daily Price Chart: Confluence of Support
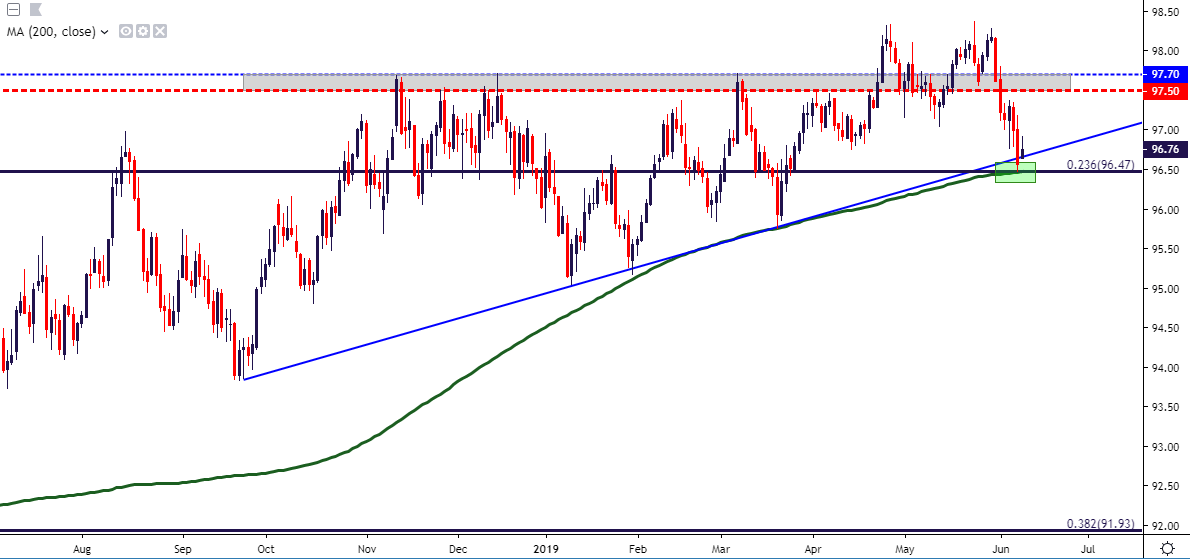
Chart prepared by James Stanley
US Dollar: From Ascending Triangle to Rising Wedge
Coming into Q2, the US Dollar had built into an ascending triangle pattern. This is a theme in which a series of higher-lows are coupled with a horizontal level of resistance. Such a formation will often be approached in a bullish manner with the expectation of topside breakouts, looking for the same enthusiasm that’s driven bulls in at higher-lows to, eventually, take out the horizontal resistance on the chart.
And that happened earlier in Q2; sort of. Buyers did push the currency up to fresh two-year-highs in both April and May. But bulls couldn’t do much after that, leading to a bit of posturing near the highs that restrained further gains. But, those wicks on the weekly chart from failed attempts from buyers have built-in another formation of note, and that’s a rising wedge pattern. From those highs, a bullish trend-line has shown, but this trend-line carries a weaker angle than that of the support trend-line, leading to the formation of this pattern. And this one, unlike the ascending triangle, will often be approached with the aim of bearish reversals, looking for the lack of enthusiasm from buyers at or near highs to, eventually, carry over for a re-test of support ahead of a down-side break.
This places even more emphasis on Fibonacci support around 96.47. A break-below can expose a series of levels underneath price action.
US Dollar Weekly Price Chart
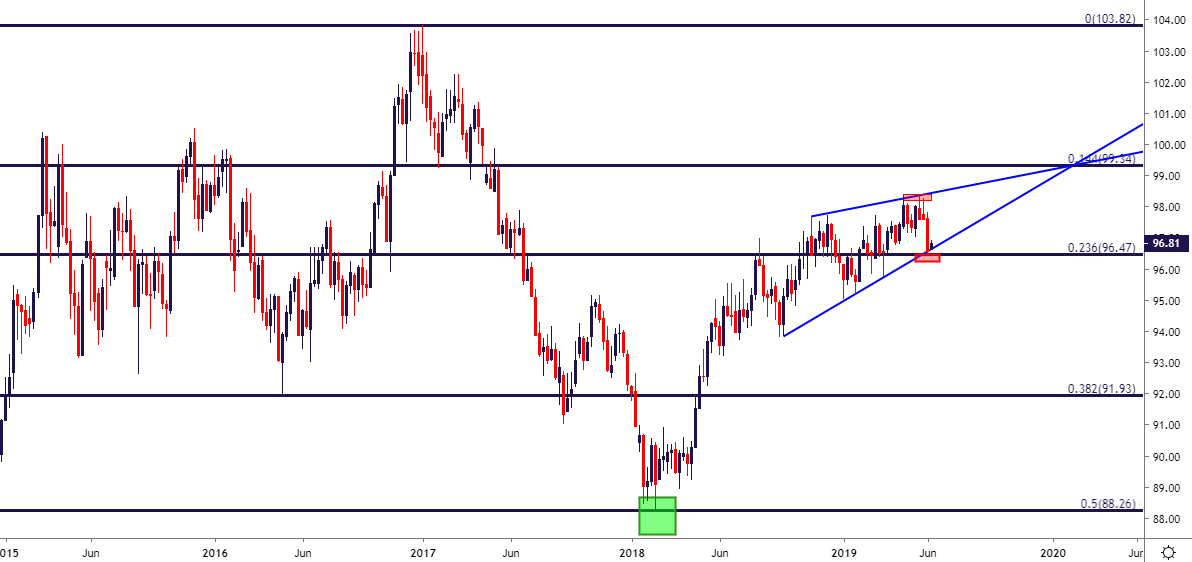
Chart prepared by James Stanley
EURUSD Might Have Room to Rally Should USD Breakdown Continue
Should the US Dollar continue to break-down, there are a series of interesting options for traders to work with. Key of which is the pair that likely few would harbor many bullish aspirations around, as the European economy continues to struggle and political risks have continued to envelop the bloc. But, as discussed last week, these are known factors that are likely priced-in to some degree; whereas the fast shift in FOMC rate expectations is a new dynamic that may still have some room to be priced-in. If this does show-up, the topside of EURUSD could be interesting on a near-term basis. I had looked at this backdrop in this week’s FX Setups, looking for EURUSD bulls to show higher-low support above the key area of prior resistance, taken from around 1.1250-1.1265. This can keep the door open for risk levels below last Friday’s low.
EURUSD Four-Hour Price Chart
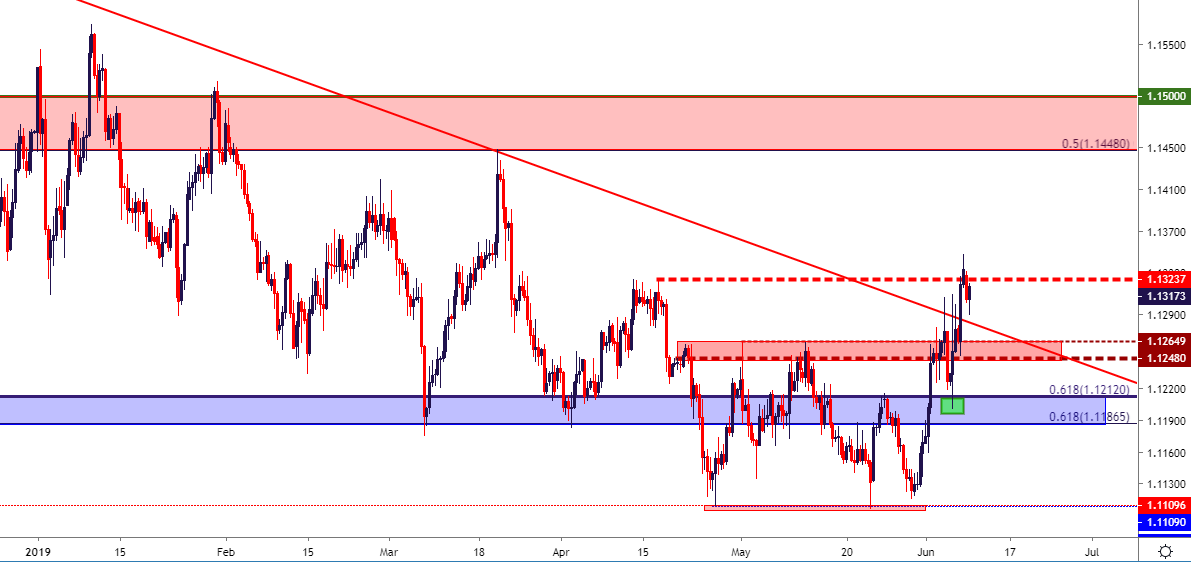
Chart prepared by James Stanley
AUDUSD Reacts to Resistance: Can Sellers Hold the Move
On the other side of the US Dollar, AUDUSD may retain some interest for bearish themes which, in-turn, would be bullish around the US Dollar. Last week brought upon the peculiar situation of a rate-hike rally in AUDUSD, likely owed to the similar theme looked at above with last week’s rate cut being adequately priced-in ahead of the announcement.
AUDUSD rallied all the way up to the resistance zone looked at that spans from .7000-.7019. Price action has been on retreat so far this week, moving down for a quick test of last week’s support around the .6960 level. This keeps the pair of interest for USD-strength strategies; and should the US Dollar pose a bounce this week, target potential could be opened up on AUDUSD around the .6900 level, followed by the five-month-lows at .6860.
AUDUSD Four-Hour Price Chart

Chart prepared by James Stanley
To read more:
Are you looking for longer-term analysis on the U.S. Dollar? Our DailyFX Forecasts have a section for each major currency, and we also offer a plethora of resources on Gold or USD-pairs such as EUR/USD, GBP/USD, USD/JPY, AUD/USD. Traders can also stay up with near-term positioning via our IG Client Sentiment Indicator.
Forex Trading Resources
DailyFX offers an abundance of tools, indicators and resources to help traders. For those looking for trading ideas, our IG Client Sentiment shows the positioning of retail traders with actual live trades and positions. Our trading guides bring our DailyFX Quarterly Forecasts and our Top Trading Opportunities; and our real-time news feed has intra-day interactions from the DailyFX team. And if you’re looking for real-time analysis, our DailyFX Webinars offer numerous sessions each week in which you can see how and why we’re looking at what we’re looking at.
If you’re looking for educational information, our New to FX guide is there to help new(er) traders while our Traits of Successful Traders research is built to help sharpen the skill set by focusing on risk and trade management.
--- Written by James Stanley, Strategist for DailyFX.com
Contact and follow James on Twitter: @JStanleyFX


