


Canadian Dollar Technical Forecast: USD/CAD Weekly Trade Levels
- Canadian Dollar updated technical trade levels - Weekly Chart
- USD/CAD rally extends into confluent resistance - threat for exhaustion / price inflection
- Support 1.3512, 1.3370/84 (key), 1.3224 – Resistance 1.3971 (key), 1.4098, 1.4336
The US Dollar breakout has crushed the Canadian Dollar by nearly 8% off the September lows in USD/CAD with the rally extending into a key technical confluence today on the back of hotter than anticipated US inflation data (CPI). While the medium-term outlook remains weighted to the topside, the immediate advance may be vulnerable while below this threshold. These are the updated targets and invalidation levels that matter on the USD/CAD weekly technical price chart. Review my latest Strategy Webinar for an in-depth breakdown of this Loonie setup and more.
855292659
Canadian Dollar Price Chart – USD/CAD Weekly
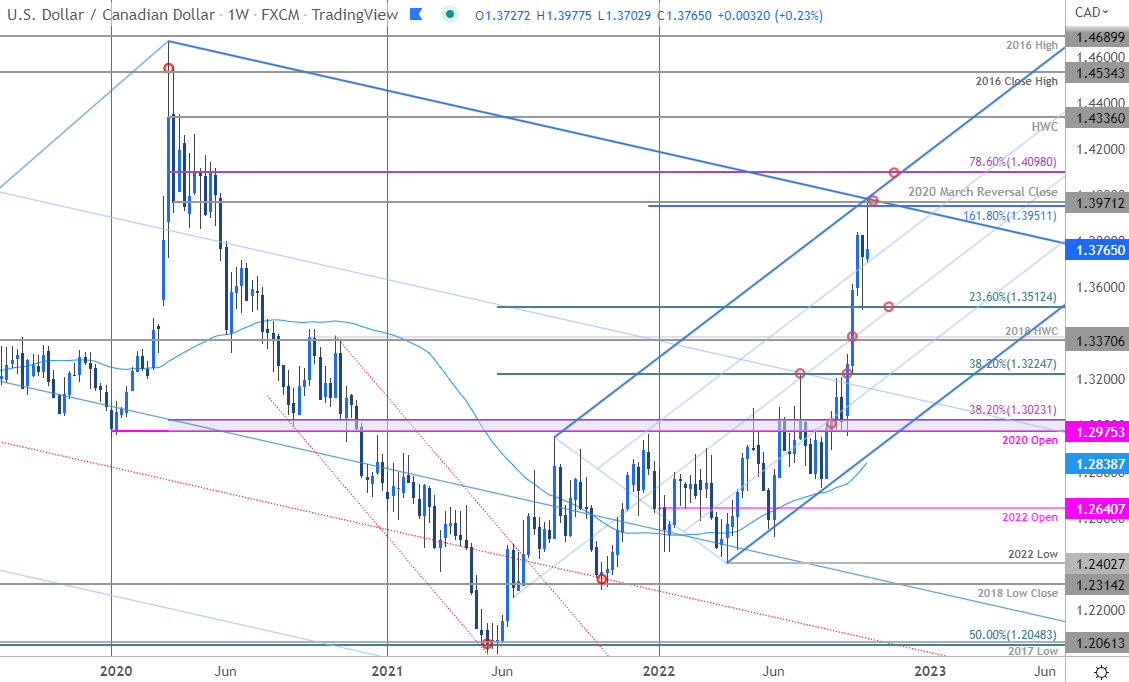
Chart Prepared by Michael Boutros, Technical Strategist; USD/CAD on Tradingview
Notes: In last month’s Canadian Dollar Weekly Technical Forecast, I noted to, “be on the lookout for downside exhaustion ahead of 1.3370 IF price is indeed heading higher on this stretch – a close above 1.3812 is needed to mark resumption with the next major level of resistance eyed at the 2020 March reversal-close at 1.3971.” A pullback from near-term resistance saw USD/CAD register a low at 1.3502 the following week before ripping higher with today’s advance registering a high at 1.3977! We’re on the lookout for possible price inflection here into this technical confluence zone.
Initial weekly support rests around the median-line / last week’s low / 23.6% Fibonacci retracement of the 2021 advance at 1.3502/12 – a weekly close below this threshold would be needed to suggest a more significant high was registered this week with broader bullish invalidation now raised to the 2018 high-week close / September 2020 high-close at 1.3370/84.
A topside breach / close above this key pivot zone is needed to keep the immediate long-bias viable with subsequent topside resistance objectives eyed at the 78.6% retracement of the 2020 decline at 1.4098 and the 2020 high-week close at 1.4336.

Bottom line: The USD/CAD breakout has now extended into confluent trend resistance- risk for possible topside exhaustion / price inflection into this threshold. From a trading standpoint, a good zone to reduce long-exposure / raise protective stops- losses should be limited to the median-line IF price is indeed heading higher on this stretch with a weekly close above 1.3971 needed to fuel the next leg towards 1.41 and beyond. I’ll publish an updated Canadian Dollar Shor-term Price Outlook once we get further clarity on the near-term USD/CAD technical trade levels.
For a complete breakdown of Michael’s trading strategy, review his Foundations of Technical Analysis series on Building a Trading Strategy
Canadian Dollar Trader Sentiment – USD/CAD Price Chart
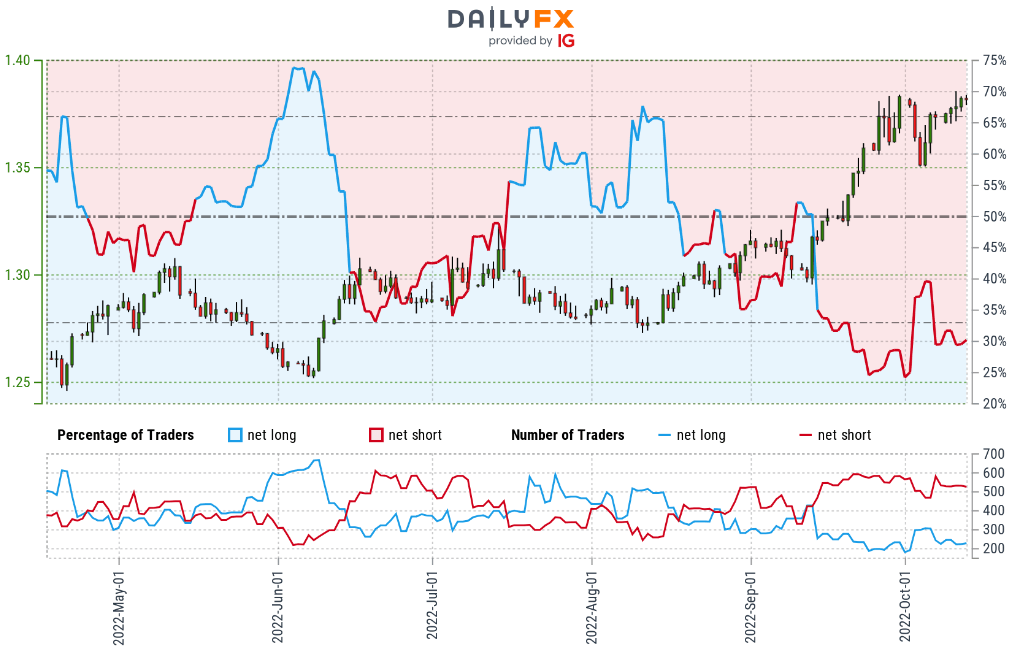
- A summary of IG Client Sentiment shows traders are net-short USD/CAD - the ratio stands at -2.23 (31.00% of traders are long) – typically bullish reading
- Long positions are 8.30% higher than yesterday and 15.93% lower from last week
- Short positions are 4.55% higher than yesterday and 18.71% higher from last week
- We typically take a contrarian view to crowd sentiment, and the fact traders are net-short suggests USD/CAD prices may continue to rise. Traders are less net-short than yesterday but more net-short from last week. The combination of current positioning and recent changes gives us a further mixed USD/CAD trading bias from a sentiment standpoint.
| Change in | Longs | Shorts | OI |
| Daily | -2% | 7% | 5% |
| Weekly | -30% | 38% | 13% |
US / Canada Economic Calendar
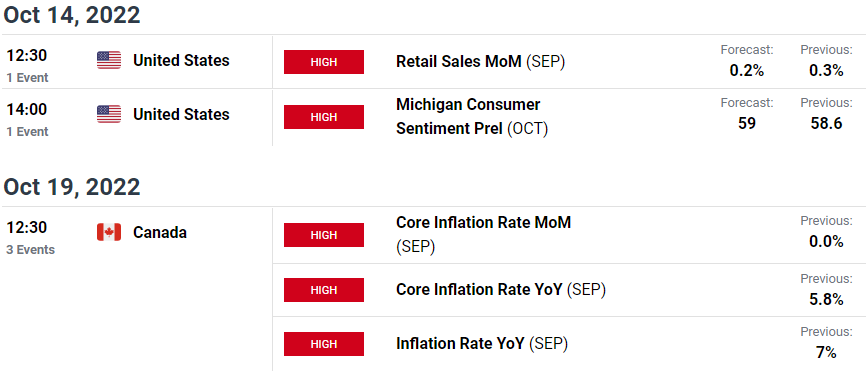
Economic Calendar - latest economic developments and upcoming event risk.
Active Weekly Technical Charts
- Gold (XAU/USD)
- S&P 500, Nasdaq & Dow
- US Dollar Index (DXY)
- British Pound (GBP/USD)
- Euro (EUR/USD)
- Crude Oil (WTI)
- Australian Dollar (AUD/USD)
- Japanese Yen (USD/JPY)
--- Written by Michael Boutros, Technical Strategist with DailyFX
Follow Michael on Twitter @MBForex


