


British Pound Technical Price Outlook: GBP/USD Weekly Trade Levels
- Sterling technical trade level update – Weekly Chart
- GBP/USD recovery rips into first major test of resistance- risk for exhaustion / price inflection
- Weekly resistance 1.1414/80 (key), 1.1650, 1.1843-1.1950 – Support 1.1160, 1.1060, 1.0790-1.0840
The British Pound surged more than 3% against the US Dollar into the October open with GBP/USD attempting to snap a six-day winning streak today. A massive rally off fresh record lows has responded to the first major pivot zone and we’re looking for a reaction in the days ahead of guidance on whether a larger Sterling rebound is underway. These are the updated targets and invalidation levels that matter on the GBP/USD weekly chart heading into October. Review my latest Strategy Webinar for an in-depth breakdown of this Sterling technical setup and more.
British Pound Price Chart - GBP/USD Weekly
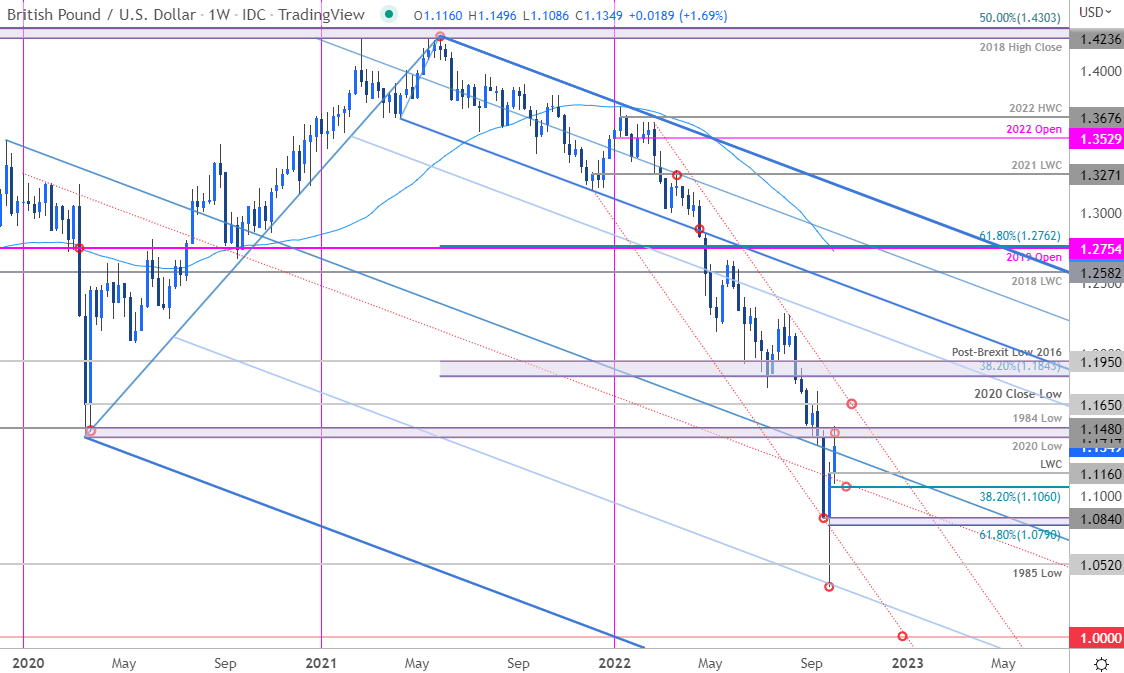
Chart Prepared by Michael Boutros, Technical Strategist; GBP/USD on Tradingview
Notes: In last month’s British Pound Weekly Technical Forecast we noted that the GBP/USD collapse had, “responded to downtrend support on a massive multi-week stretch to fresh record lows. The threat for a larger recovery remains on the back of this sell-off and the focus is for possible topside exhaustion into the October open.” Sterling ripped more than 11% off the lows on a six-day rally with the advance now approaching a critical pivot zone and the origin of the September breakdown at 1.1414/80- a region defined by the 2020 low and the 1984 low. Looking for possible price inflection off this threshold.
Initial support now rests at the record low-week close at 1.1160 backed by 1.1060. Ultimately a break / weekly-close below the 61.8% Fibonacci retracement / low-close at 1.0790-1.0840 is needed to mark resumption of the broader downtrend. Note that such a scenario would likely fuel another accelerated sell-off towards the 1985 lows again at 1.0520 and beyond. A breach higher from here would challenge a test of yearly downtrend resistance around the 2020 close lows at ~1.1650. Broader bearish invalidation now lowered to the 38.2% retracement of the 2021 decline / 2016 post-Brexit low at 1.1843-1.1950.
For a complete breakdown of Michael’s trading strategy, review his Foundations of Technical Analysis series on Building a Trading Strategy
Bottom Line: The British Pound recovery is now approaching the first major test at a key pivot zone- looking for possible price inflection / exhaustion off this mark. From a trading standpoint, risk for some pullback here - losses would need to be limited to 1.0790 to suggest a more significant low was registered last month. Ultimately, we’re looking for a breakout of the 1.1060-1.1480 range for guidance here- stay nimble and respect the weekly close with regards to the median-line. I’ll publish an updated Sterling short-term trade outlook once we get further clarity on the near-term GBP/USD technical trade levels.

British Pound Trader Sentiment - GBP/USD Price Chart
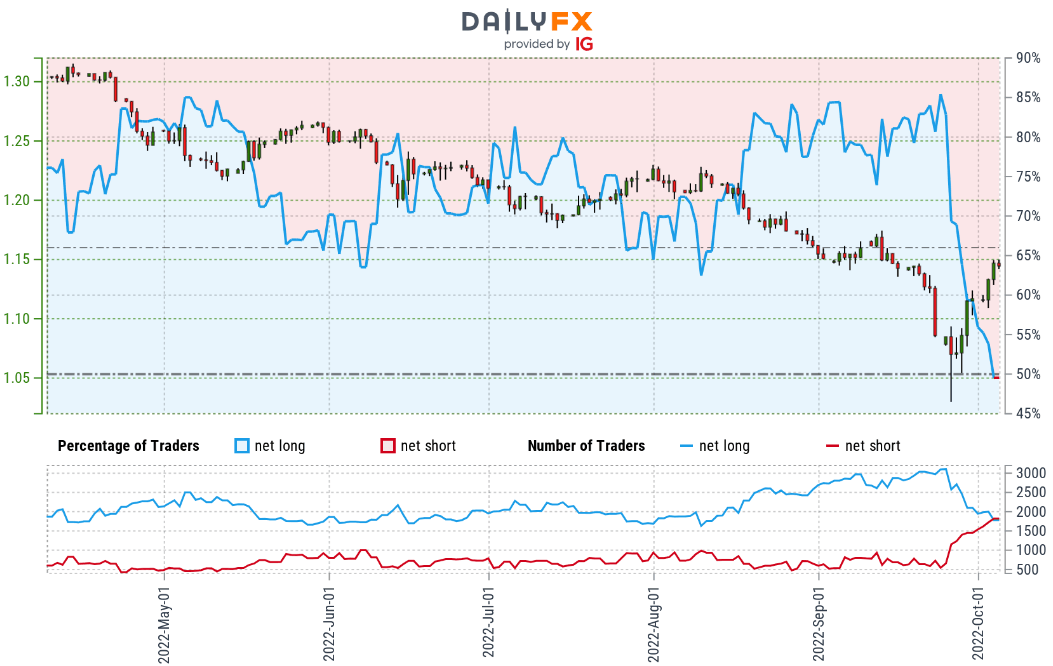
- A summary of IG Client Sentiment shows traders are net-long GBP/USD - the ratio stands at +1.02 (50.42% of traders are long) – typically neutral reading
- Long positions are 9.64% lower than yesterday and 33.00% lower from last week
- Short positions are 9.29% higher than yesterday and 51.61% higher from last week
- We typically take a contrarian view to crowd sentiment, and the fact traders are net-long suggests GBP/USD prices may continue to fall. Yet traders are less net-long than yesterday and compared with last week. From a sentiment standpoint, the recent changes in positioning warn that the current GBP/USD price trend may soon reverse higher despite the fact traders remain net-long.
| Change in | Longs | Shorts | OI |
| Daily | 3% | -7% | -3% |
| Weekly | 4% | -10% | -5% |
UK / US Economic Calendar
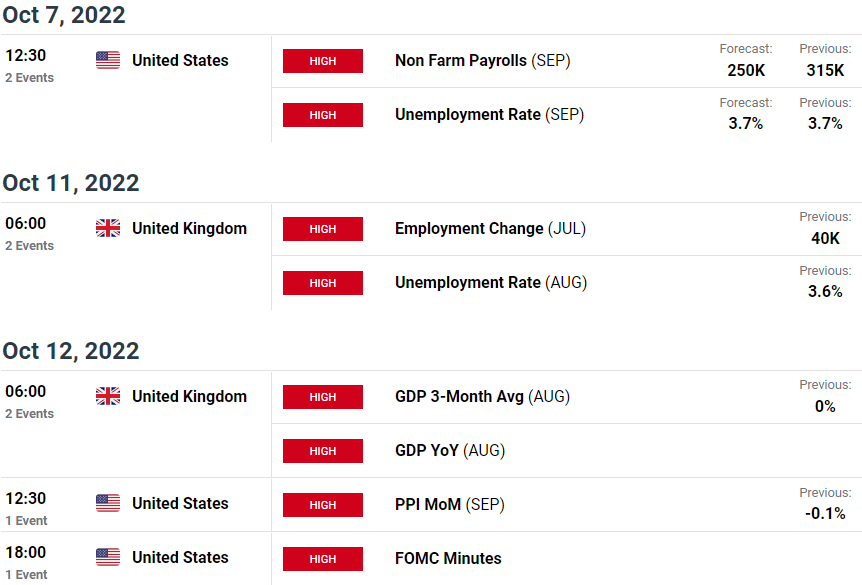
Economic Calendar - latest economic developments and upcoming event risk.
Active Weekly Technical Charts
- US Dollar Index (DXY)
- Canadian Dollar (USD/CAD)
- Euro (EUR/USD)
- Gold (XAU/USD)
- Crude Oil (WTI)
- Australian Dollar (AUD/USD)
- S&P 500, Nasdaq & Dow
- Japanese Yen (USD/JPY)

--- Written by Michael Boutros, Technical Strategist with DailyFX
Follow Michael on Twitter @MBForex


