


British Pound Technical Price Outlook: GBP/USD Weekly Trade Levels
- Sterling technical trade level update – Weekly Chart
- GBP/USD collapses into downtrend support / record lows- risk for exhaustion into October open
- Weekly resistance 1.11, 1.1290s, 1.1414/80 (key) – Support 1.0640, 1.0520, 1.0350s, parity
The British Pound plunged more than 4.6% against the US Dollar into the weekly open before paring the entire decline with GBP/USD responding to long-term downtrend support. While the broader outlook remains weighted to the downside, the threat of a near-term recovery may offer more favorable opportunities into the October open. These are the updated targets and invalidation levels that matter on the GBP/USD weekly chart into the close of the quarter. Review my latest Strategy Webinar for an in-depth breakdown of this Sterling technical setup and more.
British Pound Price Chart - GBP/USD Weekly
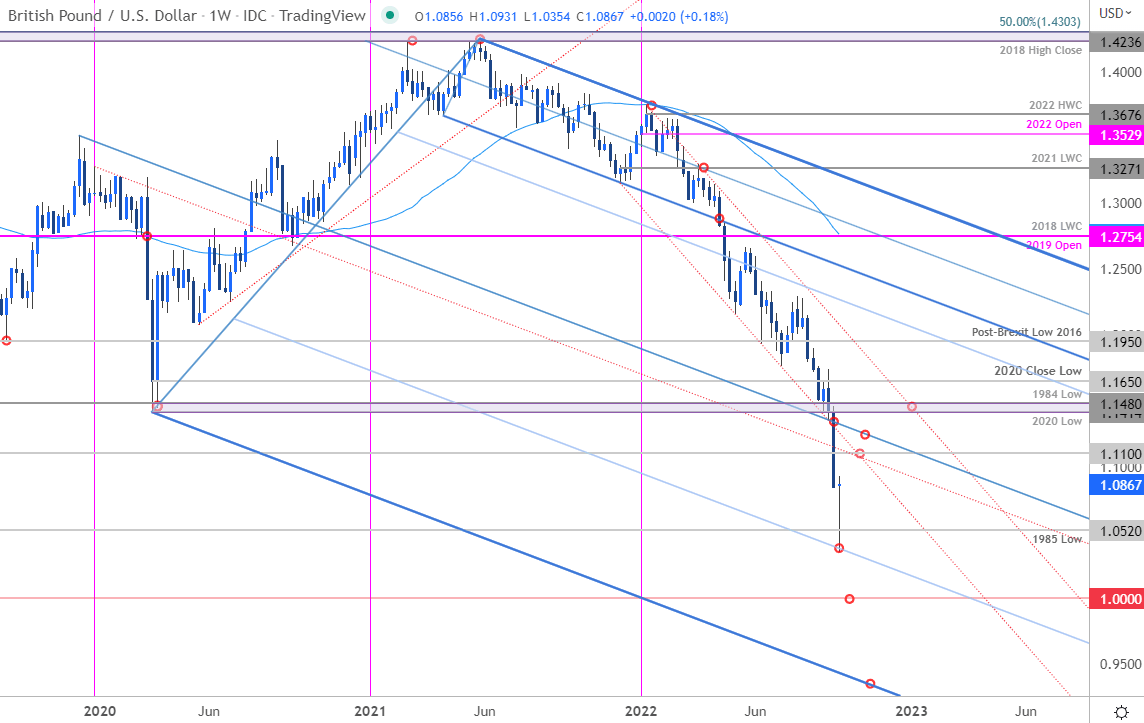
Chart Prepared by Michael Boutros, Technical Strategist; GBP/USD on Tradingview
Notes: In my last British Pound Weekly Technical Forecast we noted that GBP/USD was approaching a, “key support pivot at the 2020 / 1984 lows at 1.1414/80- looking for possible price inflection off this zone in the days ahead. A break / close below this threshold would risk substantial Sterling losses. . .” Cable collapsed the following week with price plummeting more than 11.7% off the September highs – the decline exhausted / rebounded (with precision) this week off the 25% parallel of the descending pitchfork formation we’ve been tracking off the 2019 / 2020 highs. The risk is for some back & fill here into the close of the month after failing to hold fresh record lows.
Initial weekly resistance now eyed back at the 1.11-handle backed by the median-line (currently ~1.1290s). Ultimately, a breach / close back above 1.1414/80 would be needed to suggest a more significant low was registered this week. Initial weekly support rests with the 1985 record low-close at 1.0640 backed by the 1985 low at 1.0520 and the lower parallel (~1.0350s)- weakness beyond this threshold would likely fuel another accelerated decline towards parity.
For a complete breakdown of Michael’s trading strategy, review his Foundations of Technical Analysis series on Building a Trading Strategy
Bottom Line: The British Pound plunge has responded to downtrend support on a massive multi-week stretch to fresh record lows. The threat for a larger recovery remains on the back of this sell-off and the focus is for possible topside exhaustion into the October open. From a trading standpoint, rallies should be limited to 1.1480 IF price is indeed heading lower with a break / weekly close below 1.0520 needed to mark resumption of the broader downtrend. Stay nimble heading into the close of the month / quarter with key US inflation data on Friday likely to fuel some volatility here. I’ll publish an updated Sterling short-term trade outlook once we get further clarity on the near-term GBP/USD technical trade levels.

British Pound Trader Sentiment - GBP/USD Price Chart
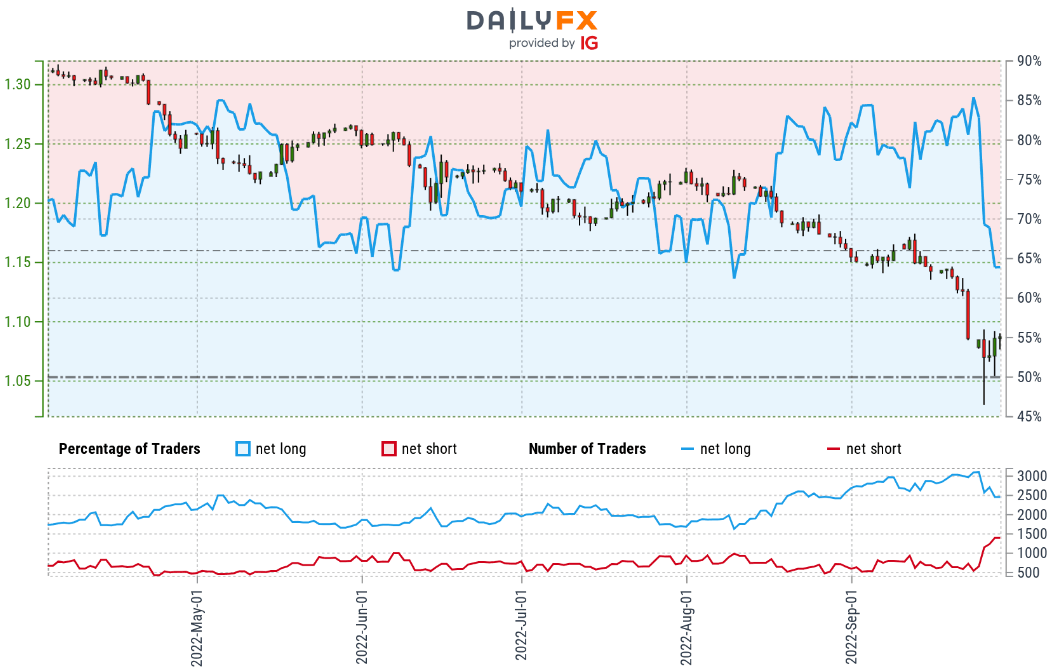
- A summary of IG Client Sentiment shows traders are net-long GBP/USD - the ratio stands at +1.99 (66.57% of traders are long) – typically bearish reading
- Long positions are 5.27% lower than yesterday and 9.73% lower from last week
- Short positions are 2.77% lower than yesterday and 87.18% higher from last week
- We typically take a contrarian view to crowd sentiment, and the fact traders are net-long suggests GBP/USD prices may continue to fall. Yet traders are less net-long than yesterday and compared with last week. Recent changes in sentiment warn that the current GBP/USD price trend may soon reverse higher despite the fact traders remain net-long.
{{SENTIMENT|GBPUSD|Learn how shifts in GBP/USD retail positioning impact trend}}
UK / US Economic Calendar
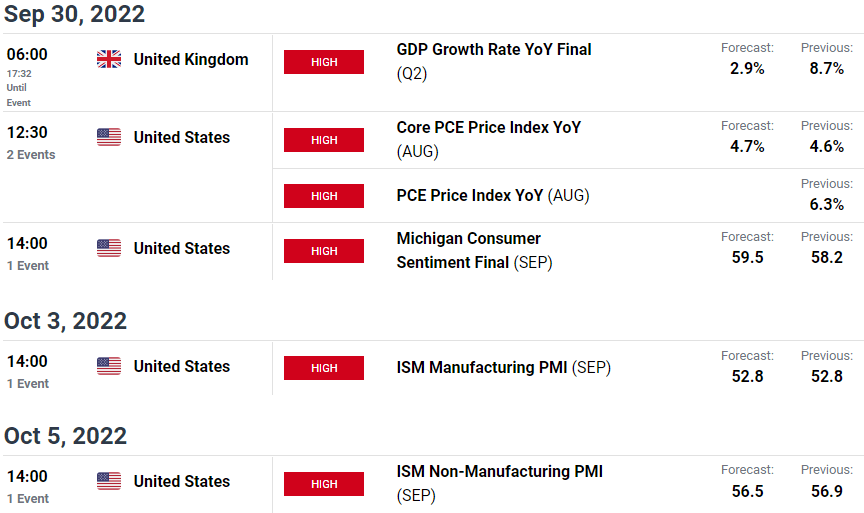
Economic Calendar - latest economic developments and upcoming event risk.
Active Weekly Technical Charts
- Canadian Dollar (USD/CAD)
- Euro (EUR/USD)
- Gold (XAU/USD)
- Crude Oil (WTI)
- Australian Dollar (AUD/USD)
- S&P 500, Nasdaq & Dow
- Japanese Yen (USD/JPY)
- US Dollar Index (DXY)
Foundational Trading Knowledge
Forex for Beginners
New to Forex Trading? Get started with this Beginners Guide
--- Written by Michael Boutros, Technical Strategist with DailyFX
Follow Michael on Twitter @MBForex


