


Canadian Dollar Technical Forecast: USD/CAD Weekly Trade Levels
- Canadian Dollar updated technical trade levels - Weekly Chart
- USD/CAD rally exhausts into key resistance levels- threat for near-term exhaustion
- Support 1.3370/84, 1.3230 (key), 1.2975-1.3023– Resistance 1.3651-1.3708, 1.3812, 1.3971 (key)
The Canadian Dollar has been in freefall against the US Dollar for weeks now with USD/CAD rallying through key technical resistance to fresh multi-year highs. The advance is now showing signs of possible topside exhaustion and while the broader focus remains weighted to the topside, the threat of a pullback may offer more favorable opportunities heading into the October open. These are the updated targets and invalidation levels that matter on the USD/CAD weekly technical price chart. Review my latest Weekly Strategy Webinar for an in -depth breakdown of this Loonie technical setup and more.
Canadian Dollar Price Chart – USD/CAD Weekly
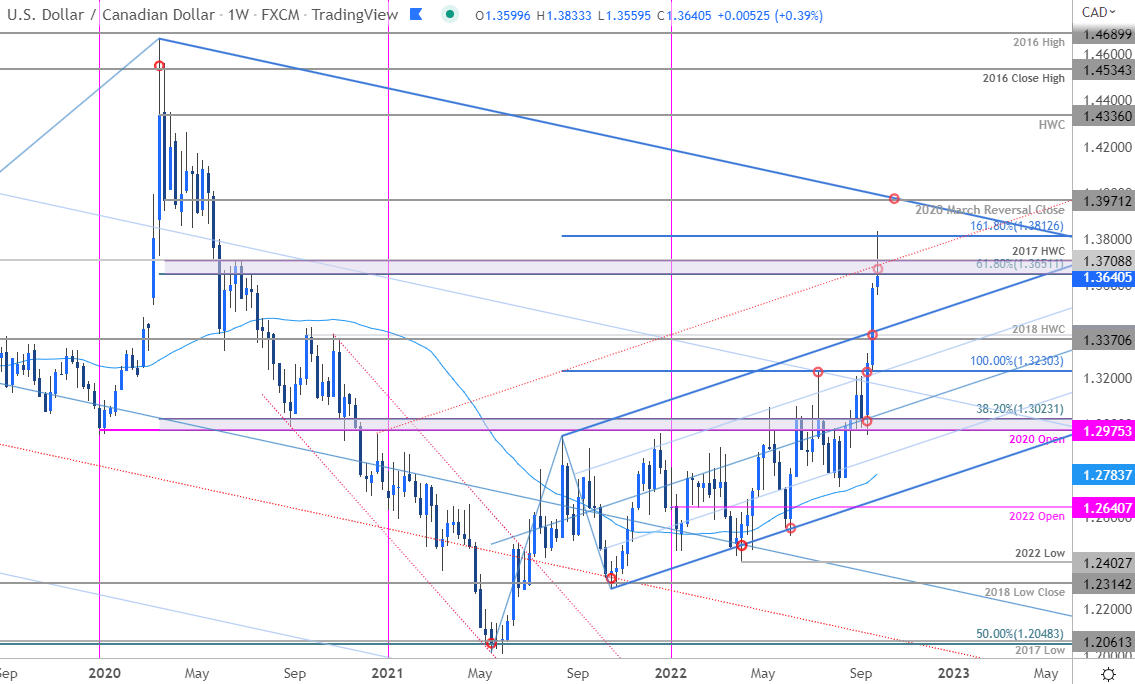
Chart Prepared by Michael Boutros, Technical Strategist; USD/CAD on Tradingview
Notes: In my last Canadian Dollar Weekly Technical Forecast we highlighted the threat of a pullback in USD/CAD as price was approaching technical uptrend resistance at the highlighted confluence zone around 1.3230. We noted that, “losses should be limited to 1.2975 IF price is heading higher on this rally,” with a breach / close above needed mark resumption. Price briefly registered an intraday low at 1.2953 in the following days before reversing sharply higher with a breakout of the monthly opening-range on September 16th clearing the way for a rally of more than 6.7% off the monthly low.
The advance exhausted into the 1.618% extension of the 2021 advance at 1.3812 (high registered at 1.3833) before pulling back with price now trading back below a key pivot zone at 1.3651-1.3708- a region defined by the 61.8% Fibonacci retracement of the 2020 decline and the 2017 high-week close. Watch the weekly close with respect to this range. Initial support now rests back at the 2018 high-week close / September 2020 high-close at 1.3370/84 with broader bullish invalidation now raised to 1.3230.

Bottom line: A multi-week rally USD/CAD may be vulnerable to near-term exhaustion here after extending through key technical targets. From a trading standpoint, be on the lookout for downside exhaustion ahead of 1.3370 IF price is indeed heading higher on this stretch – a close above 1.3812 is needed to mark resumption with the next major level of resistance eyed at the 2020 March reversal-close at 1.3971. I’ll publish an updated Canadian Dollar Shor-term Price Outlook once we get further clarity on the near-term USD/CAD technical trade levels.
For a complete breakdown of Michael’s trading strategy, review his Foundations of Technical Analysis series on Building a Trading Strategy
Canadian Dollar Trader Sentiment – USD/CAD Price Chart
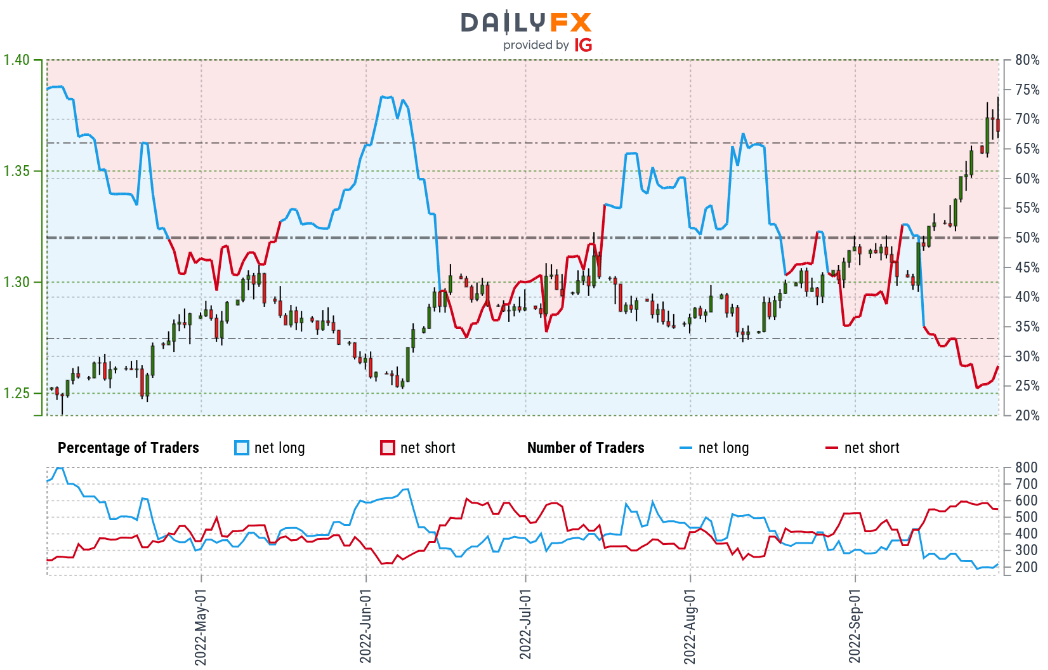
- A summary of IG Client Sentiment shows traders are net-short USD/CAD - the ratio stands at -2.44 (29.10% of traders are long) – typically bullish reading
- Long positions are 10.93% lower than yesterday and 23.88% lower from last week
- Short positions are 1.11% lower than yesterday and 17.79% lower from last week
- We typically take a contrarian view to crowd sentiment, and the fact traders are net-short suggests USD/CAD prices may continue to rise. Traders are further net-short than yesterday and last week, and the combination of current positioning and recent changes gives us a stronger USD/CAD-bullish contrarian trading bias from a sentiment standpoint.
| Change in | Longs | Shorts | OI |
| Daily | -2% | 7% | 5% |
| Weekly | -30% | 38% | 13% |
---
US / Canada Economic Calendar
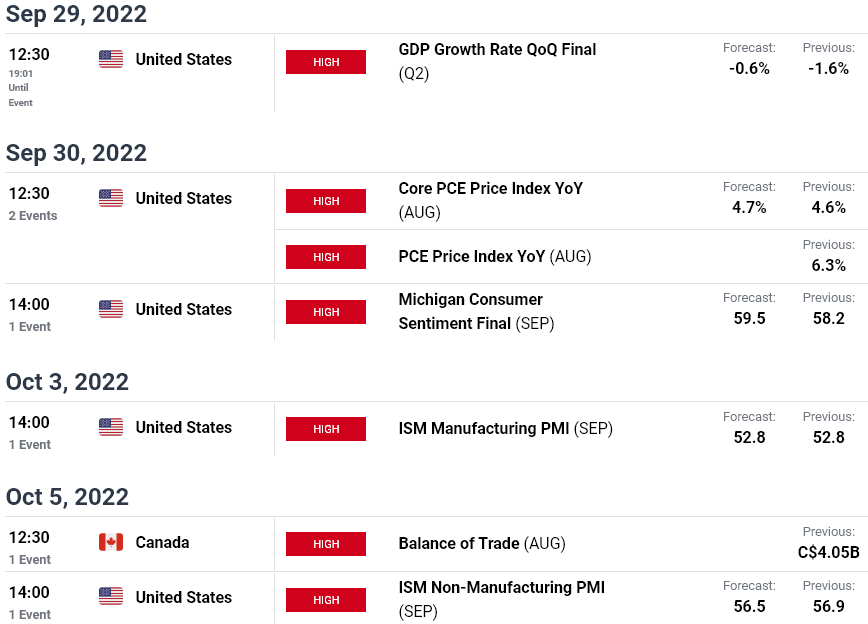
Economic Calendar - latest economic developments and upcoming event risk.
Active Weekly Technical Charts
- Euro (EUR/USD)
- Gold (XAU/USD)
- Crude Oil (WTI)
- British Pound (GBP/USD)
- Australian Dollar (AUD/USD)
- S&P 500, Nasdaq & Dow
- Japanese Yen (USD/JPY)
- US Dollar Index (DXY)
--- Written by Michael Boutros, Technical Strategist with DailyFX
Follow Michael on Twitter @MBForex


