


Canadian Dollar Technical Forecast: USD/CAD Weekly Trade Levels
- Canadian Dollar updated technical trade levels - Weekly Chart
- USD/CAD breakout stalls ahead of uptrend resistance- threat for near-term exhaustion
- Support 1.3023, 1.2840s, 1.2709/38 (critical) – Resistance 1.3223/30 (key), 1.3370, 1.3651
The Canadian Dollar eased more than 3.7% against the US Dollar since the August lows in USD/CAD with price once again approaching resistance near the yearly highs. While the broader outlook remains constructive, the advance may be vulnerable here and the threat of a near-term washout has us on guard for a possible reset. These are the updated targets and invalidation levels that matter on the USD/CAD weekly technical price chart. Review my latest Weekly Strategy Webinar for an in-depth breakdown of this Loonie technical setup and more.
Canadian Dollar Price Chart – USD/CAD Weekly
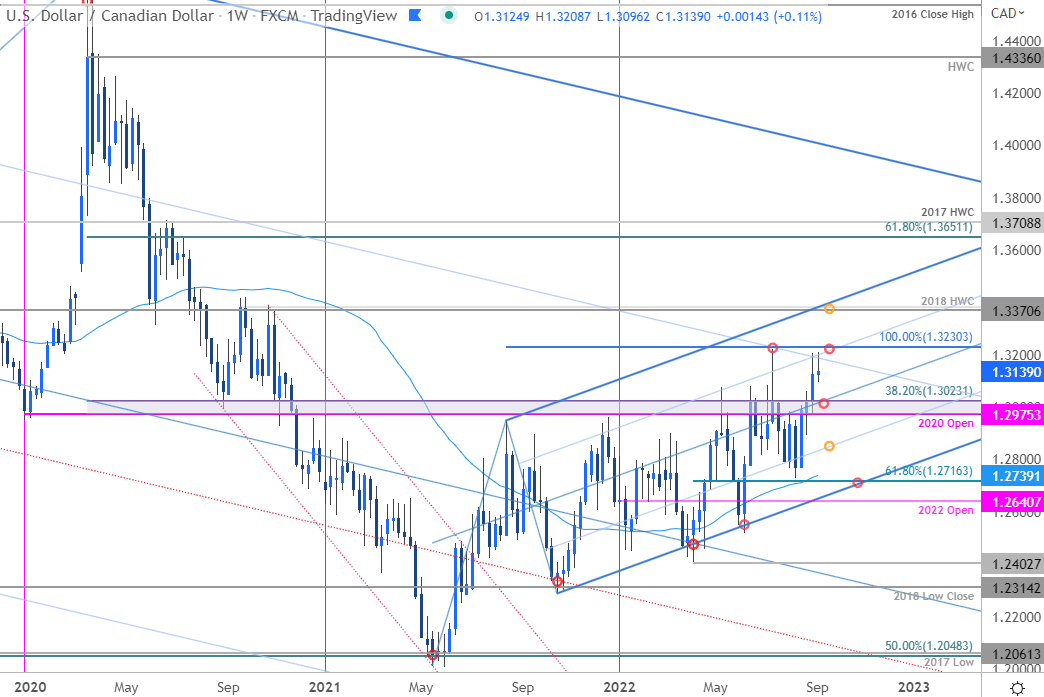
Chart Prepared by Michael Boutros, Technical Strategist; USD/CAD on Tradingview
Notes: In last month’s Canadian Dollar Weekly Technical Forecast we noted to be on the lookout for possible downside exhaustion / price inflection on test of key support, “at the 52-week moving average / 61.8% Fibonacci retracement of the yearly range at 1.2709/16…” USD/CAD registered a low at 1.2727 in the following days before reversing sharply higher into the close of August.
A three-week rally takes price into the 75% parallel with key resistance into the yearly high / 100% extension of the 2021 advance at 1.3223/30. A breach / close above this threshold is needed to fuel the next leg higher towards the 2018 high-week close / upper parallel at ~1.3370s- look for a larger reaction in price there IF reached. Initial weekly support now rests back at 1.3023 backed by the 25% parallel (currently ~1.2840s). Broader bullish invalidation now raised to 1.2709/38.

Bottom line: USD/CAD is approaching confluent uptrend resistance and while the broader outlook remains tilted to the topside the advance may be vulnerable to a near-term wash-out. From at trading standpoint, look to reduce portions of long-exposure / raise protective stops on stretches towards 1.3230s – losses should be limited to 1.2975 IF price is heading higher on this rally. Keep in mind we have Canada employment data on tap Friday with US inflation data slated for next week ahead of FOMC. Expect some volatility here. I’ll publish an updated Canadian Dollar Shor-term Price Outlook once we get further clarity on the near-term USD/CAD technical trade levels.
For a complete breakdown of Michael’s trading strategy, review his Foundations of Technical Analysis series on Building a Trading Strategy
Canadian Dollar Trader Sentiment – USD/CAD Price Chart

- A summary of IG Client Sentiment shows traders are net-short USD/CAD - the ratio stands at -1.42 (41.41% of traders are long) – typically bullish reading
- Long positions are20.00% higher than yesterday and 2.48% higher from last week
- Short positions are 4.50% lower than yesterday and 7.71% lower from last week
- We typically take a contrarian view to crowd sentiment, and the fact traders are net-short suggests USD/CAD prices may continue to rise. Yet traders are less net-short than yesterday and compared with last week. From a sentiment standpoint, the recent changes in sentiment warn that the current USD/CAD price trend may soon reverse lower despite the fact traders remain net-short.
| Change in | Longs | Shorts | OI |
| Daily | -2% | 7% | 5% |
| Weekly | -30% | 38% | 13% |
---
US / Canada Economic Calendar

Economic Calendar - latest economic developments and upcoming event risk.
Active Weekly Technical Charts
- Japanese Yen (USD/JPY)
- US Dollar Index (DXY)
- Euro (EUR/USD)
- Crude Oil (WTI)
- British Pound (GBP/USD)
- Gold & Silver
- S&P 500, Nasdaq, Dow
--- Written by Michael Boutros, Technical Strategist with DailyFX
Follow Michael on Twitter @MBForex


