


Crude Oil Technical Forecast: WTI Weekly Trade Levels
- Crude Oil updated technical trade levels – Weekly Chart
- WTI plunge testing critical support pivot for a fifth-week – risk for inflection off 85.61-88.01
- New to Oil Trading? Get started with this Free How to Trade Oil-Beginners Guide
Crude oil prices plunged more than 30% off the June highs with WTI spilling into a key technical support zone. Despite a steep weekly sell-off and a range of nearly 11%, oil continues to trade just above this critical zone for the fifth-consecutive week – this is a BIG moment for crude heading into the September open. These are the updated targets and invalidation levels that matter on the oil price weekly technical chart. Review my latest Strategy Webinar for an in-depth breakdown of this crude oil price technical setup and more.
Crude Oil Price Chart – WTI Weekly

Chart Prepared by Michael Boutros, Technical Strategist; Crude Oil (WTI) on Tradingview
Notes: In last month’s Crude Oil Weekly Technical Forecast we noted that WTI had, “rebounded off a critical support pivot and we’re looking for continued inflection off this mark for guidance. While we cannot rule out another test of the 2020/2021 uptrend, the focus is on validating a medium-term low in the weeks ahead.” The zone in focus was and remains 85.61-88.01- a region defined by the 2013 low, the 100% extension of the March decline and the 61.8.% retracement of the November advance. Price registered a low at 85.70 in mid-August with the monthly opening-range preserved heading into the September open. Despite the losses of the past three-days, oil prices continue to hold above this key support level, for now. . . Yet again- its decision time and we look for inflection off this critical zone.
A break below the 2020 slope (blue) would be technically damaging for crude with such a scenario threatening a decline towards the objective 2020 yearly open / 2018 high at 75.35-76.87- an area of interest for downside exhaustion / price inflection IF reached. Initial weekly resistance now stands at the median-line (currently ~96.50s) backed by the 38.2% Fibonacci retracement of the June decline at 100.21. Broader bearish invalidation now lowered to the June high-week close / 61.8% retracement at 109.16-110.

Bottom line: Oil prices are back at a critical support zone into the start of the month at a major inflection zone. The focus remains on a reaction off this key threshold into September- watch the weekly close. From a trading standpoint, a good zone to reduce portions of short-exposure / lower protective stops- keep in mind we are heading into the monthly open with US Non-Farm Payrolls on tap ahead of an extended holiday break. Tread lightly and stay nimble here- this is a big level and a significant resolution in price may be just ahead. Review my latest Crude Oil Short-term Technical Outlook for a closer look at the near-term WTI technical trade levels.
For a complete breakdown of Michael’s trading strategy, review his Foundations of Technical Analysis series on Building a Trading Strategy
Crude Oil Trader Sentiment – WTI Price Chart
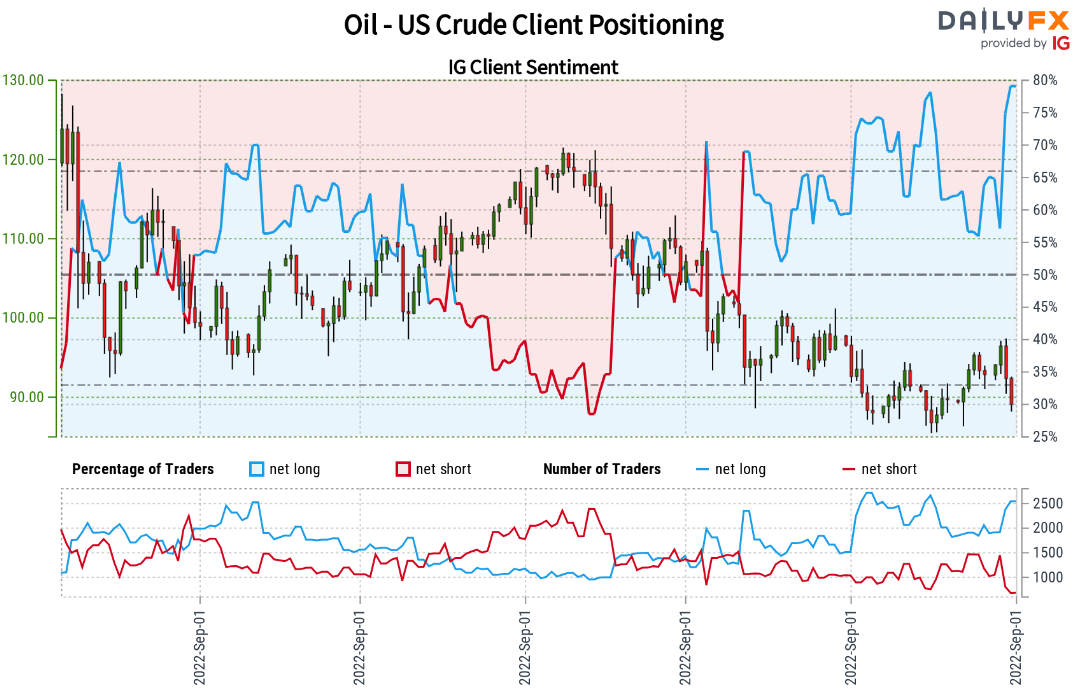
- A summary of IG Client Sentiment shows traders are net-long crude oil - the ratio stands at +3.51 (77.85% of traders are long) – typically bearishreading
- Long positions are 9.24% higher than yesterday and 32.83% higher from last week
- Short positions are 13.81% lower than yesterday and 49.86% lower from last week
- We typically take a contrarian view to crowd sentiment, and the fact traders are net-long suggests WTI prices may continue to fall. Traders are further net-long than yesterday and last week, and the combination of current positioning and recent changes gives us a stronger Crude oil-bearish contrarian trading bias from a sentiment standpoint.
| Change in | Longs | Shorts | OI |
| Daily | 3% | -5% | 0% |
| Weekly | -14% | 14% | -7% |
---
Active Weekly Technical Charts
- British Pound (GBP/USD)
- US Dollar Index (DXY)
- Gold & Silver
- S&P 500, Nasdaq, Dow
- Canadian Dollar (USD/CAD)
- US Dollar Index (DXY)
- Euro (EUR/USD)

--- Written by Michael Boutros, Technical Strategist with DailyFX
Follow Michael on Twitter @MBForex


