


Gold Technical Price Forecast:XAU/USD Weekly Trade Levels
- Gold price updated trade levels - Weekly Technical Chart
- XAU/USD rally off trend support marks fourth week– now testing downtrend resistance
- Silver recovery testing key downtrend resistance – August opening-range in focus
- Get started with this Free How to Trade Gold -Beginners Guide s
Gold prices have rallied more than 7.5% off the yearly lows with XAU/USD attempting to mark a fourth consecutive weekly advance. The rebound off downtrend support is now testing downtrend resistance and we’re looking for a pivot off this zone in the days ahead for guidance. Similarly, silver is testing a key resistance zone and battle lines are drawn heading into the start of the week. These are the updated targets and invalidation levels that matter on the XAU/USD and XAG/USD weekly technical price charts.
Review my latest Weekly Strategy Webinar for an in-depth breakdown of this gold technical setup and more.
Gold Price Chart - XAU/USD Weekly
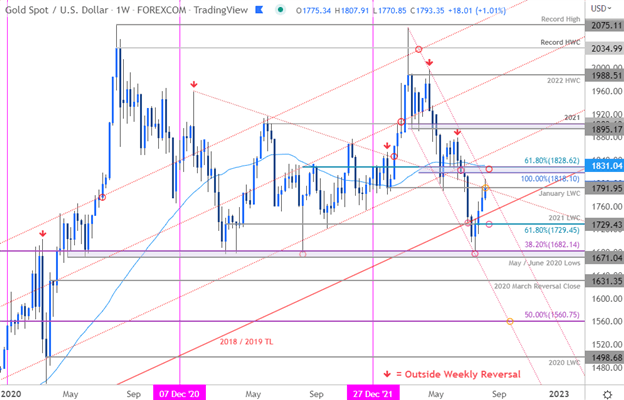
Chart Prepared by Michael Boutros, Technical Strategist; Gold on Tradingview
Notes: In my last Gold Weekly PriceOutlook we noted that XAU/USD had, “rebounded off downtrend support and we’re looking for a reaction / possible inflection on a stretch towards yearly downtrend resistance…” A four-week advance off key support at the yearly lows has now extended into downtrend resistance and we’re looking for a reaction up here.
Key resistance remains steady at 1818/28- a region defined by the 100% extension of the yearly decline, the 61.8% Fibonacci retracement of the 2020 rally and the 52-week moving average. A breach / weekly close above this threshold is needed to suggest more significant trend reversal is underway towards the March lows / 2021 high-close at 1895-1903. Initial weekly support rests with 2018 / 2019 trendline (currently ~1750s) backed by a critical threshold atthe 2021 & 2022 low-week closes / 61.8% retracement of the July rally at 1727/29. A break / weekly close below would be needed to threaten resumption of the yearly downtrend back towards 1671/82.

Bottom line: Golds recovery off downtrend support is now testing downtrend resistance- looking for a reaction / price inflection up here in the days ahead. From at trading standpoint, a good zone to reduce portions of long-exposure / raise protective stops – losses should be limited to 1727 IF price is indeed heading higher on this stretch with a breach / close above the 52-week moving average needed to suggest a more significant low is in place for gold. Review my latest Gold Price Outlook for a closer look at the near-term XAU/USD technical trade levels.
For a complete breakdown of Michael’s trading strategy, review his Foundations of Technical Analysis series on Building a Trading Strategy
Gold Trader Sentiment – XAU/USD Price Chart
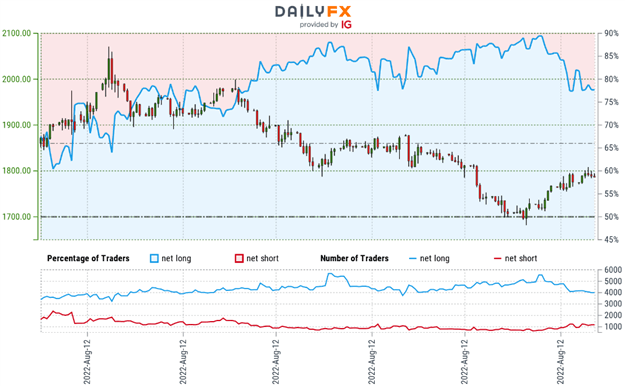
- A summary of IG Client Sentiment shows traders are net-long Gold- the ratio stands at +3.38 (77.19% of traders are long) – typically bearishreading
- Long positions are1.41% lower than yesterday and 0.84% lower from last week
- Short positions are 5.37% higher than yesterday and 2.56% lower from last week
- We typically take a contrarian view to crowd sentiment, and the fact traders are net-long suggests Gold prices may continue to fall. Yet traders are is less net-long than yesterday but more net-long from last week. From a sentiment standpoint, the combination of current positioning and recent changes gives us a further mixed Gold trading bias.
| Change in | Longs | Shorts | OI |
| Daily | -2% | -2% | -2% |
| Weekly | 3% | 16% | 10% |
Silver Price Chart - XAG/USD Weekly
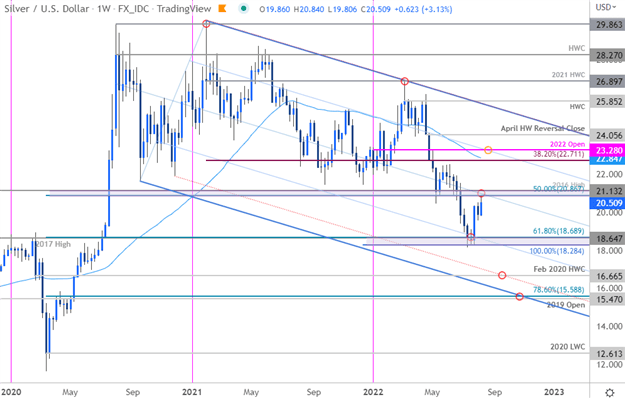
Chart Prepared by Michael Boutros, Technical Strategist; Silver on Tradingview
Notes: In my last Silver Weekly Technical Forecast we noted that XAG/USD had, “rebounded off confluent downtrend support with the advance now approaching initial downtrend resistance.” In a similar scenario as gold, silver prices are now up a staggering 14.8% off the lows with the rally testing highlighted median-line resistance at 20.86-21.13 this week. The focus is on possible price inflection up here in the days ahead. At topside breach would expose the 38.2% retracement of he 2020 decline / 52-week moving average at 22.71/84 and the objective yearly open at 23.28. Critical support steady at 18.28/69 with a close below needed to threaten resumption of the broader downtrend towards the 2020 high-week close at 16.66.
Bottom line: Silver is testing downtrend resistance here and we’re looking for a pivot off this zone to offer clarity on our medium-term directional bias. From at trading standpoint, a good zone to reduce long-exposure / raise protective stops – look for a break of the monthly opening-range (19.50-20.86) for guidance in the week ahead.
---
Active Weekly Technical Charts
- Written by Michael Boutros, Technical Strategist with DailyFX
Follow Michael on Twitter @MBForex


