


Australian Dollar Technical Price Outlook: AUD/USD Weekly Trade Levels
- Australian Dollar technical trade level update - Weekly Chart
- AUD/USD plunges back towards downtrend support US post-CPI release
- Aussie resistance 6930s, 6991-7016 (key) 7139- Support 6621/70 (critical), 6461, 6196
The Australian Dollar plunged more than 2.2% against the US Dollar on the heels of a hotter than expected US inflation read with AUD/USD now approaching multi-year downtrend support. We’re looking for possible price inflection here with a break lower threatening an even sharper Aussie sell-off. These are the updated targets and invalidation levels that matter on the AUD/USD weekly technical chart. Review my latest Weekly Strategy Webinar for an in-depth breakdown of this Aussie technical setup and more.
Australian Dollar Price Chart – AUD/USD Weekly
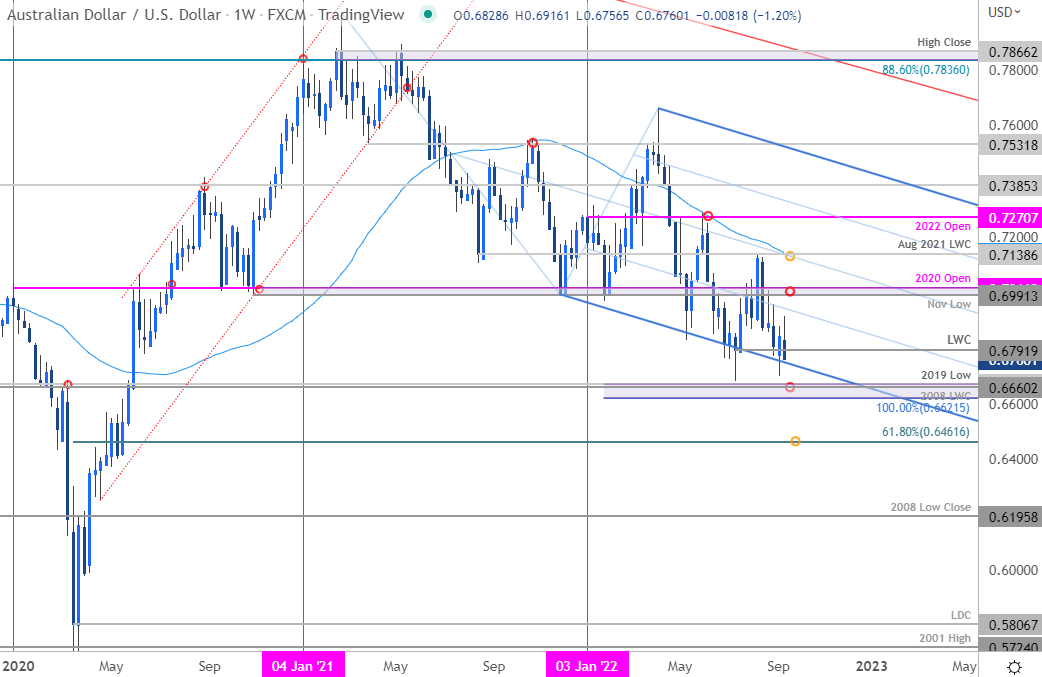
Chart Prepared by Michael Boutros, Technical Strategist; AUD/USD on Tradingview
Notes: In our July, AUD/USD Technical Forecast we highlighted that that AUD/USD had rebounded off the lower parallel of this multi-year descending pitchfork formation – that recovery failed into the median-line / August 2021 low-week close at 7138 last month before reversing sharply with the decline now once again approaching the lower parallel. It’s decision time for the Aussie bears.
A break below this slope exposes a key support pivot at 6621/70- a region defined by the 100% extension of the 2021 decline , the 2008 low-week close and the 2019 low. Ultimately, a close below this threshold would be needed to fuel the next leg lower in price towards the 61.8% Fibonacci retracement of the entire 2020 rally at 6461. Initial weekly resistance is eyed at the 25% parallel (currently ~6930s) backed by the November 2020 low / 2020 yearly open at 6991-7016. Broader bearish invalidation now lowered to the 52-week moving average which converges on the median-line around 7139.

Bottom line: The Australian Dollar is approaching multi-year downtrend support and we’re looking for a reaction in price on a stretch towards the lower parallel – watch the weekly close. From a trading standpoint, rallies should be capped by the monthly open at 6840 IF price is indeed heading lower with a close below 6621 needed to fuel the next major-leg lower in price. I’ll publish an updated Australian Dollar Price Outlook once we get further clarity on the short-term AUD/USD technical trade levels.
For a complete breakdown of Michael’s trading strategy, review his Foundations of Technical Analysis series on Building a Trading Strategy
Australian Dollar Trader Sentiment – AUD/USD Price Chart

- A summary of IG Client Sentiment shows traders are net-long AUD/USD - the ratio stands at +2.43 (70.85% of traders are long) – typically bearish reading
- Long positions are 2.41% higher than yesterday and 18.31% lower from last week
- Short positions are26.43% lower than yesterday and 19.54% lower from last week
- We typically take a contrarian view to crowd sentiment, and the fact traders are net-long suggests AUD/USD prices may continue to fall. Traders are further net-long than yesterday and last week, and the combination of current positioning and recent changes gives us a stronger AUD/USD-bearish contrarian trading bias from a sentiment standpoint.
| Change in | Longs | Shorts | OI |
| Daily | -8% | 13% | -1% |
| Weekly | -28% | 69% | -8% |
Australia / US Economic Calendar
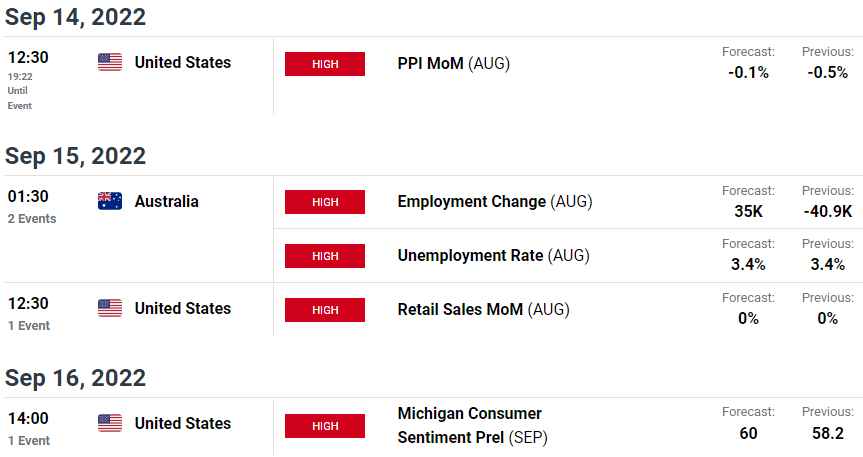
Economic Calendar - latest economic developments and upcoming event risk.
Active Weekly Technical Charts
- Gold (XAU/USD)
- S&P 500, Nasdaq & Dow
- Canadian Dollar (USD/CAD)
- Japanese Yen (USD/JPY)
- US Dollar Index (DXY)
- Euro (EUR/USD)
- Crude Oil (WTI)
- British Pound (GBP/USD)
--- Written by Michael Boutros, Technical Strategist with DailyFX
Follow Michael on Twitter @MBForex


