


Weekly Technical Trade Levels on USD Majors, Commodities & Stocks
- Technical setups we’re tracking into the weekly open
- Key levels for the US Dollar Majors, Crude Oil, Gold, Silver and more!
- New to Gold Trading? Get started with this Free How to Trade Gold -Beginners Guide
In my last Strategy Webinar we discussed the short-term threat to the US Dollar while noting that the, “focus heading into the start of the week / month / quarter is on this near-term pull-back and we’re on the lookout for a possible exhaustion low in the days / weeks ahead.” The DXY rebounded off support last week and puts the October opening-range in focus for a possible breakout in the days ahead. In this webinar we take an in-depth look at the technical trade levels for US Dollar (DXY), British Pound (GBP/USD), Euro (EUR/USD), Canadian Dollar (USD/CAD), Crude Oil (WTI), Gold (XAU/USD), Silver (XAG/USD), S&P 500 (SPX500), Nasdaq (NDX), Dow Jones Industrial Average (DJI), Australian Dollar (AUD/USD) and Bitcoin.
US Dollar Index Price Chart – DXY Daily Chart

Chart Prepared by Michael Boutros, Technical Strategist; US Dollar Index on Tradingview
Looking for a reaction on this stretch into uptrend resistance for guidance early in the week. Monthly open support at 112.17 backed by 110.25 (key). A topside breach from here would expose the yearly high close at 114.18 and the 88.6% Fibonacci retracement of the 2001 decline at 115.30.
Crude Oil Price Chart – WTI Daily
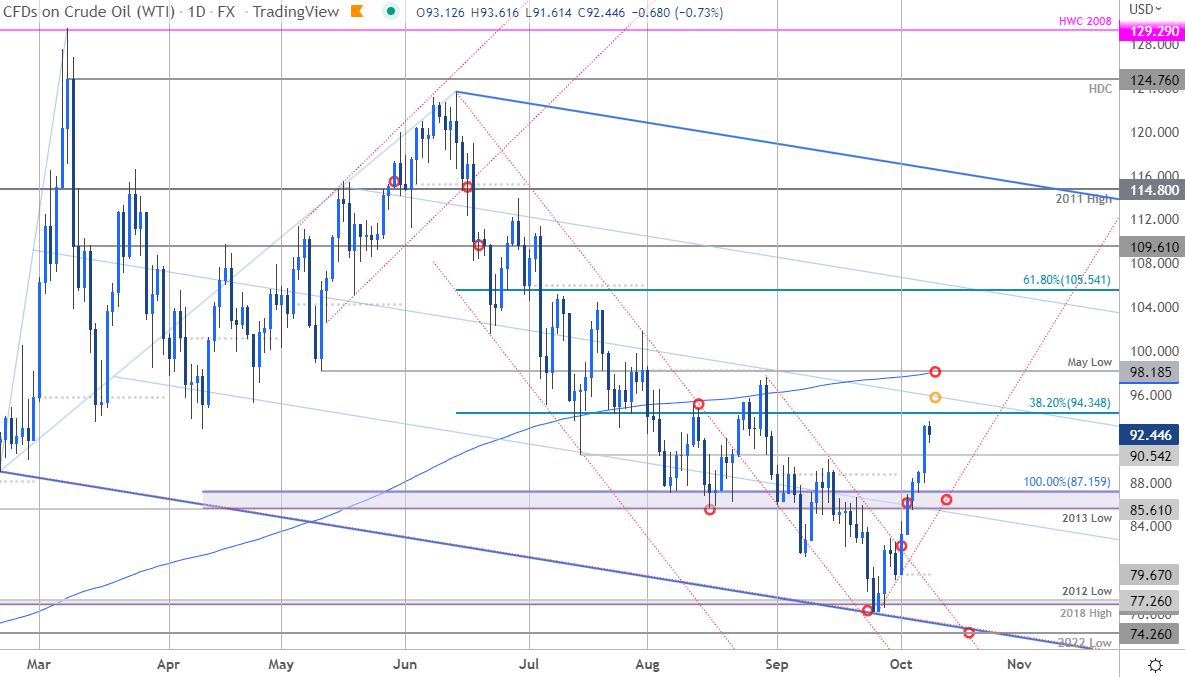
Chart Prepared by Michael Boutros, Technical Strategist; Crude Oil (WTI) on Tradingview
Crude Oil Price Chart – WTI 240min
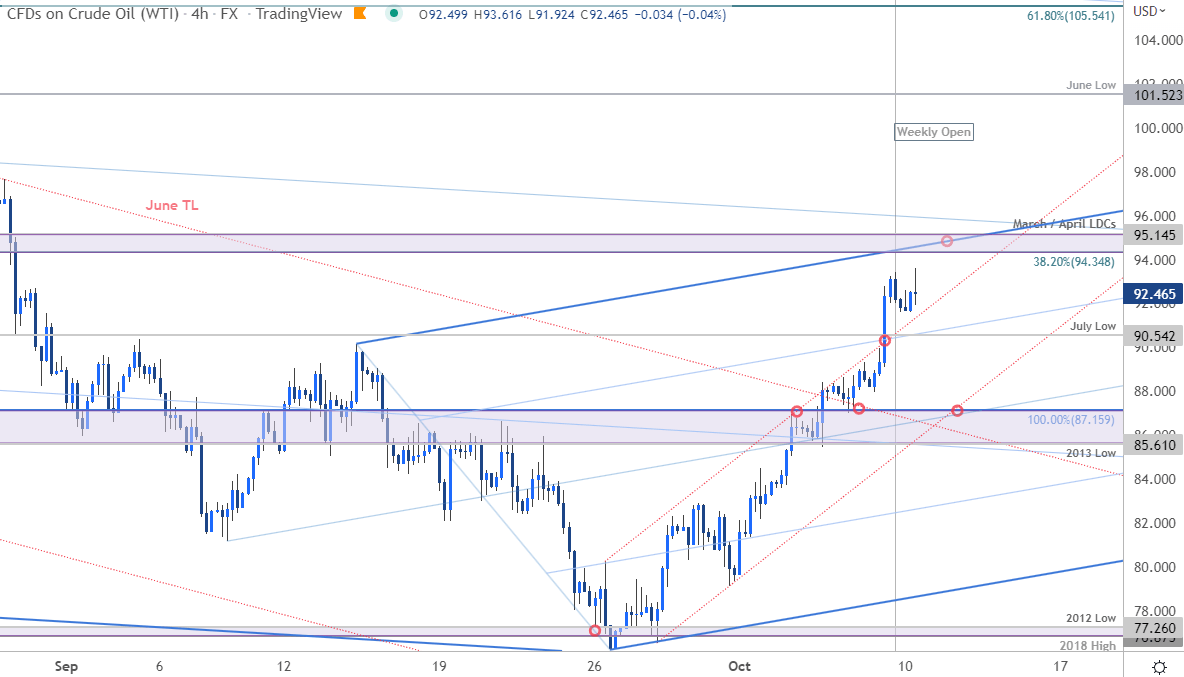
The oil price recovery is approaching levels of interest for possible price inflection as WTI approaches downtrend resistance around 94.35-94.15- looking for a reaction here for guidance in the days ahead IF reached. Key support now 85.61-87.16. A topside breach from here would threaten a run on the 200-day moving average / May low around the 98-handle.
Gold Price Chart – XAU/USD Daily
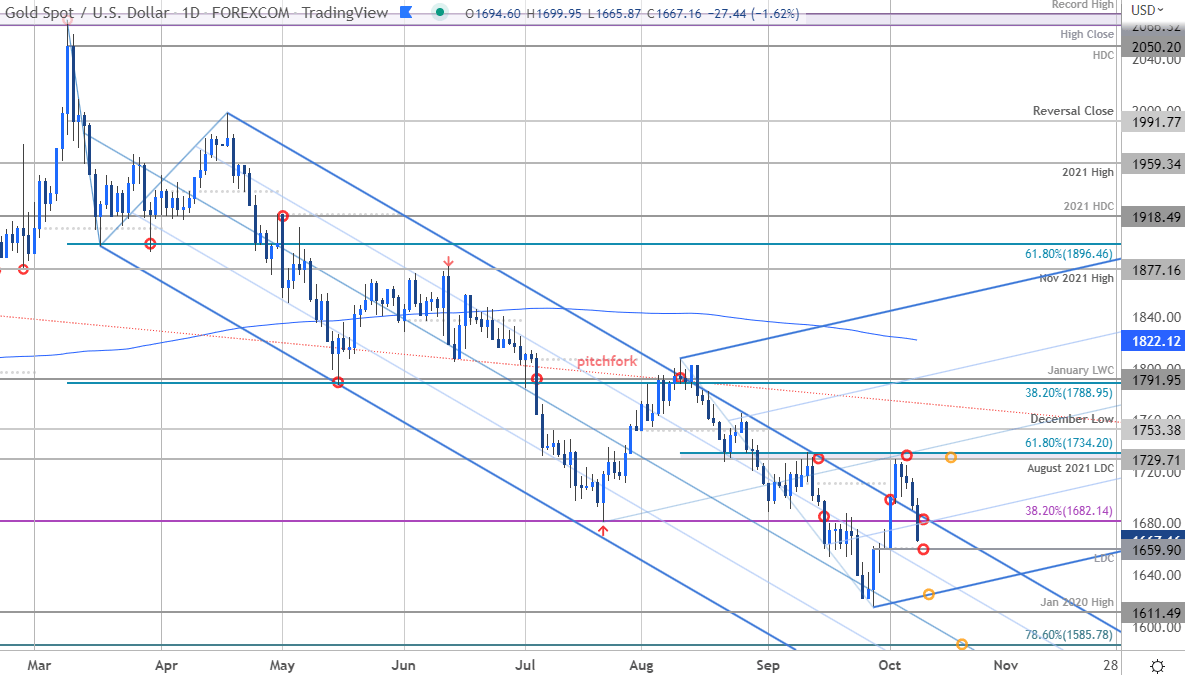
Chart Prepared by Michael Boutros, Technical Strategist; Gold on Tradingview
In my last Gold Shor-term Technical Outlook, I highlighted a, “key technical confluence at 1729/35- a region defined by the August 2021 low-day close, the 61.8% Fibonacci retracement of the August decline and the September swing high.” XAU/USD rallied and failed into this region last week before pulling back with price now plunging back towards the monthly low / monthly open / yearly low-day close at 1659- looking for a reaction here early in the week IF reached.
You can always find the latest Strategy Webinar on my YouTube playlist.
For a complete breakdown of Michael’s trading strategy, review his Foundations of Technical Analysis series on Building a Trading Strategy
Economic Calendar
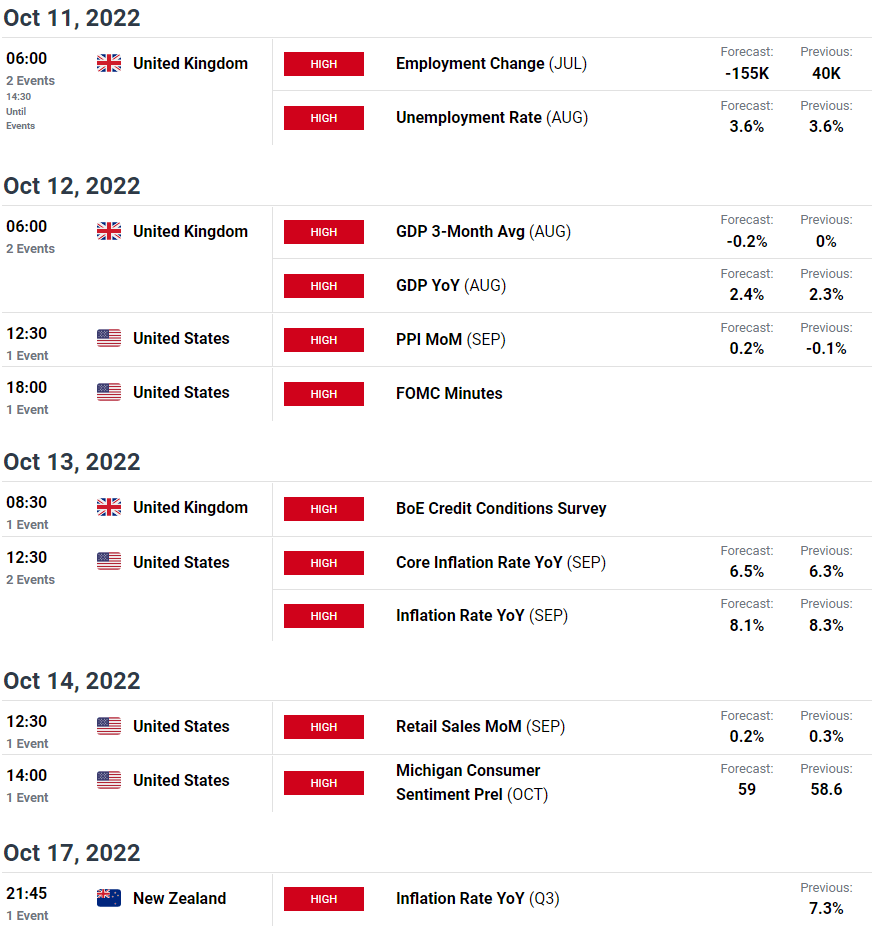
Economic Calendar - latest economic development and upcoming event risk
Foundational Trading Knowledge
Forex for Beginners
New to Forex Trading? Get started with this Beginners Guide
---Written by Michael Boutros, Technical Strategist with DailyFX
Follow Michael on Twitter @MBForex


