


Short-term Trade Outlook: Technical Setups on Crude Oil, EUR/USD & USD/CAD
- Updated charts on technicals setups we’ve been tracking in WTI, EUR/USD & USD/CAD
- Crude Oil rebound testing first major resistance pivot
- EUR/USD rally pressing yearly downtrend resistance at parity
- USD/CAD reversal off uptrend resistance searching for test of uptrend support
An update on technical setups we've been tracking in the Crude Oil, Euro and the Canadian Dollar. These are the targets and invalidation levels that matter heading into October open. Review my latest Strategy Webinar for an in-depth breakdown of these technical setups and more.
Crude Oil Price Chart - WTI 240min
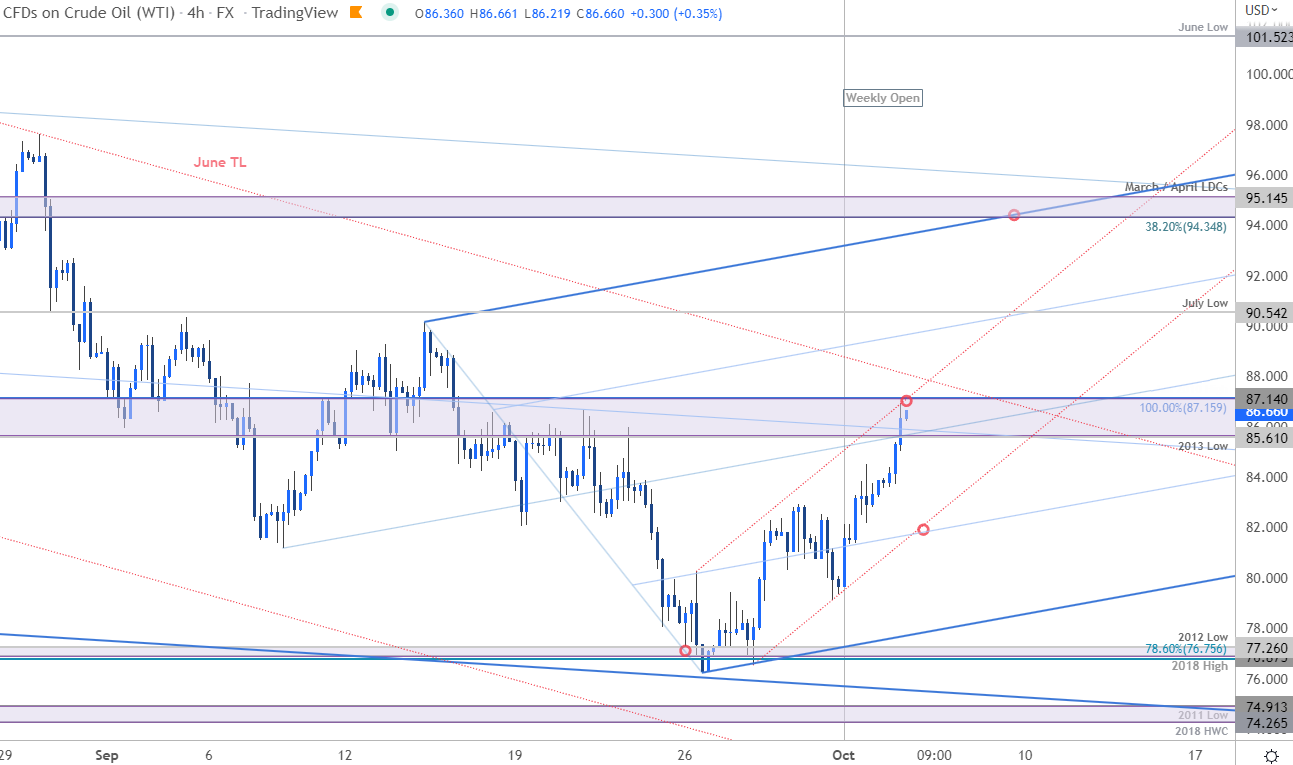
Chart Prepared by Michael Boutros, Technical Strategist; WTI on Tradingview
Notes: Oil prices are approaching a key pivot zone we’ve been tracking for months now at 85.61-87.15- a region defined by the 2013 low, the August lows and the 100% extension of the yearly decline. Looking for possible price inflection here early in the month. A breach / weekly close above would suggest a larger recovery is underway with such a scenario exposing a run towards the June lows at 90.54 and the upper parallel of this near-term ascending pitchfork formation at 94.35-95.15 (the 38.2% Fibonacci retracement of the June decline / March / April low-day closes).
Initial support seen along this short-term channel (currently ~82) with a break / close below 76.87-77.26 needed to mark resumption of the broader downtrend towards the 2018 high-week close / 2011 low at 74.26/91.
Bottom line: The oil price rebound is now approaching the first major test and we’re looking for possible inflection on test of a key resistance pivot. From a trading standpoint, a good zone to reduce long-exposure / raise protective stops- Stay nimble heading into the OPEC meeting tomorrow and watch the weekly close for guidance here with a focus on a breakout of this stretch between 82-87.15. Review my latest Crude Oil Weekly Price Outlook for a closer look at the longer-term WTI technical trade levels.
Crude Oil Trader Sentiment – WTI Price Chart
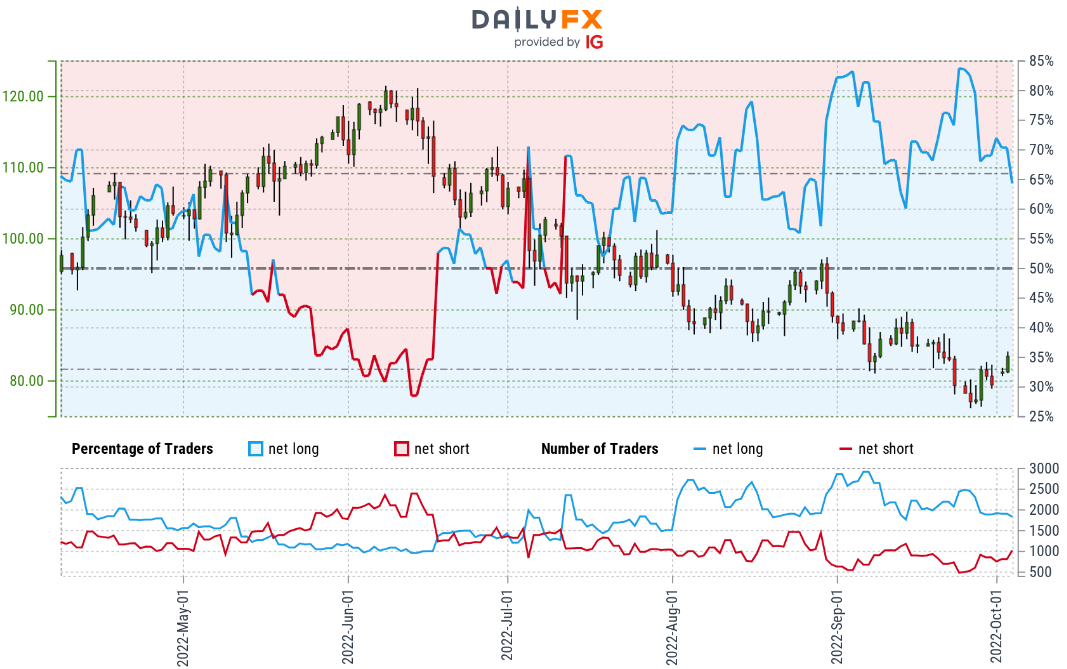
- A summary of IG Client Sentiment shows traders are net-long crude oil - the ratio stands at +1.73 (63.33% of traders are long) – typically bearish reading
- Long positions are 3.07% higher than yesterday and 21.79% lower from last week
- Short positions are 0.55% higher than yesterday and 93.09% higher from last week
- We typically take a contrarian view to crowd sentiment, and the fact traders are net-long suggests crude oil prices may continue to fall. Traders are more net-long than yesterday but less net-long from last week. The combination of current positioning and recent changes gives us a further mixed WTI trading bias from a sentiment standpoint.
Learn how shifts in Oil retail positioning impact trend
| Change in | Longs | Shorts | OI |
| Daily | 3% | -7% | 1% |
| Weekly | 31% | -38% | 7% |
Euro Price Chart – EUR/USD 240min
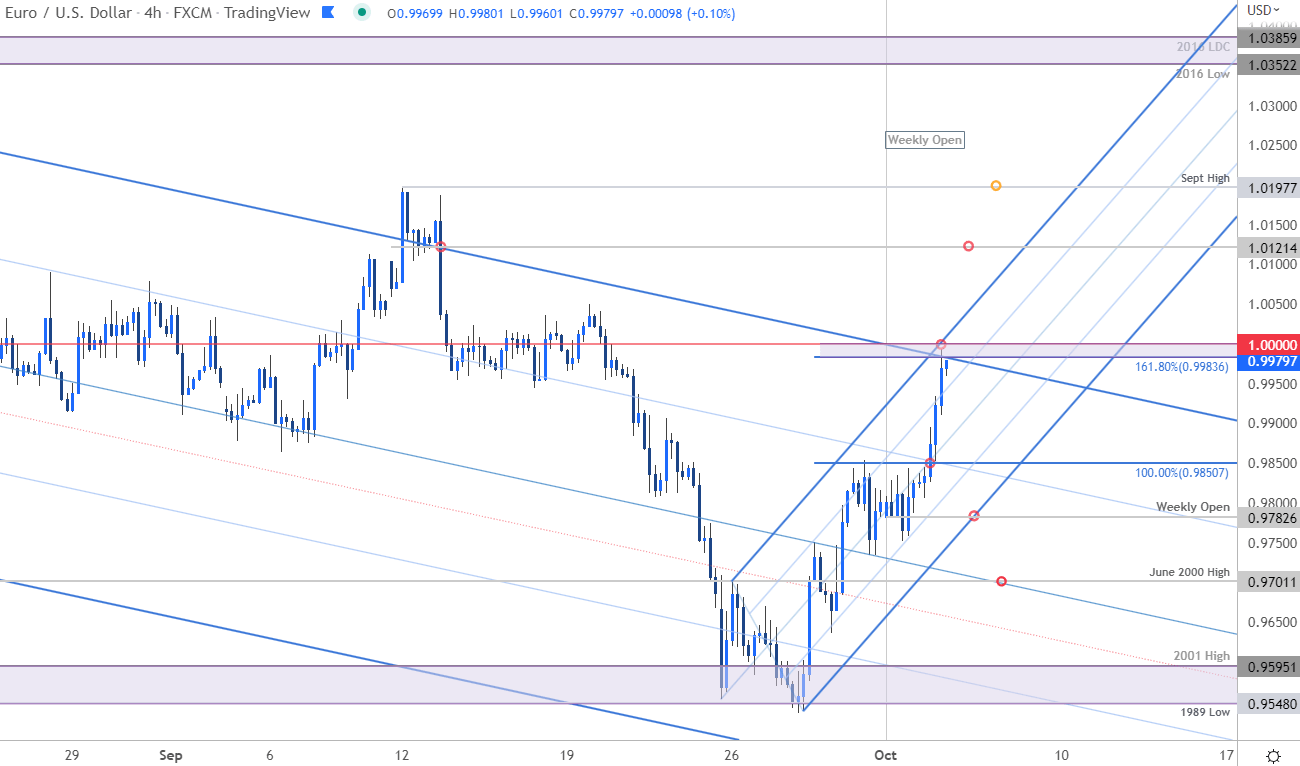
Chart Prepared by Michael Boutros, Technical Strategist; EUR/USD on Tradingview
Notes: In today’s Euro Short-term Technical Outlook we noted that, “A rebound off critical support in EUR/USD is now approaching yearly downtrend resistance into the start of the month / quarter – looking to possible exhaustion / price inflection in the days ahead for guidance.” Price is approaching this threshold now at 9983-1.0000 and the focus is on a reaction off this zone over the next few days.
A topside breach / close above exposes 1.0214 backed by the September highs at 1.0197- look for a larger reaction there IF reached. Initial support now 9850 with near-term bullish invalidation set to the weekly / monthly open at 9782. Review my Euro Weekly Price Outlook for a closer look at the longer-term EUR/USD technical trade levels.

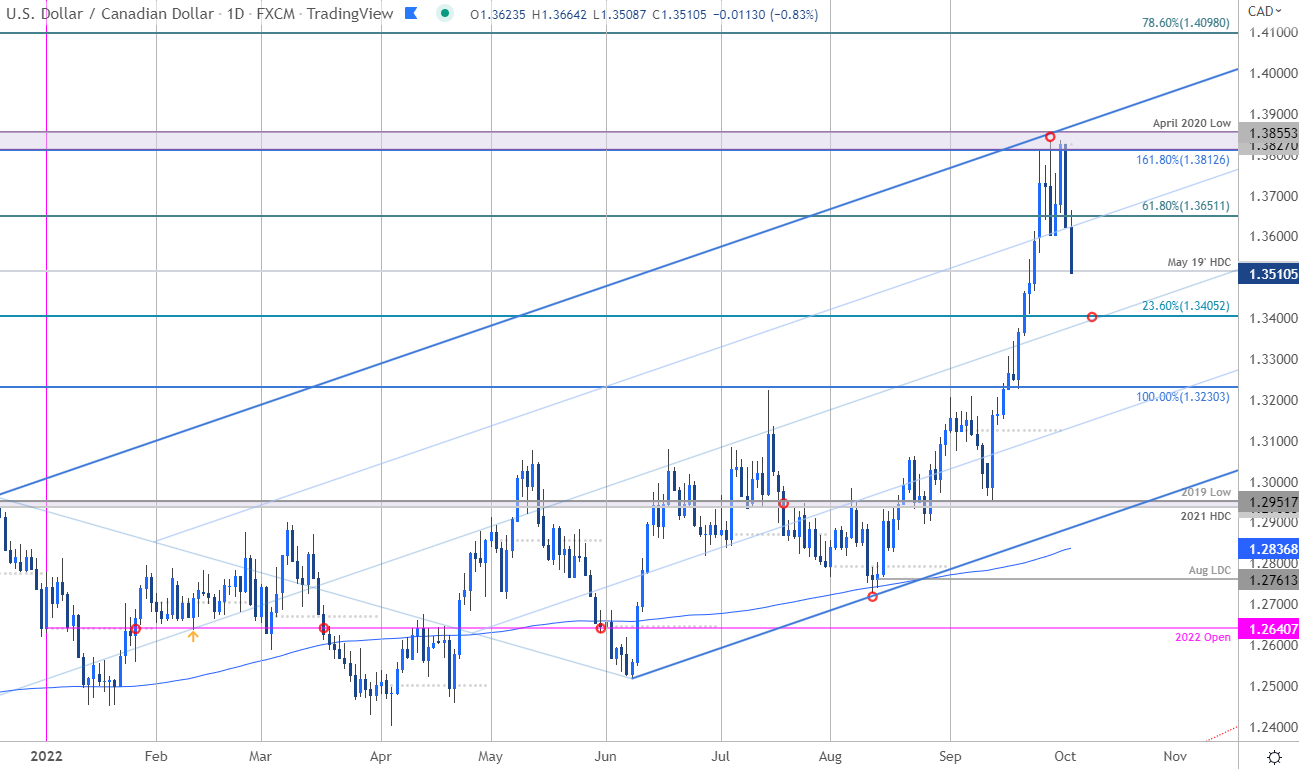
Canadian Dollar Price Chart – USD/CAD Daily
Canadian Dollar Price Chart – USD/CAD 120min
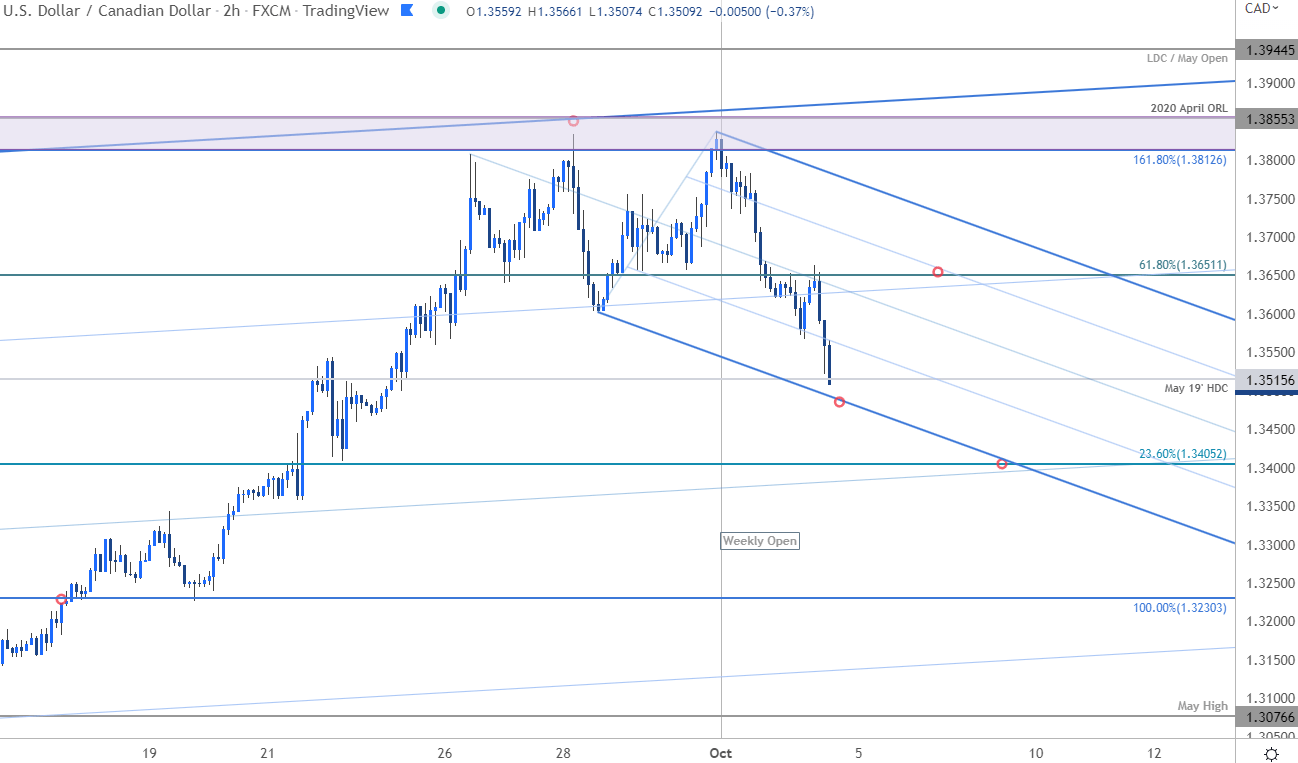
Chart Prepared by Michael Boutros, Technical Strategist; USD/CAD on Tradingview
Notes: The Canadian Dollar has rallied more than 2.3% since the start of the week / month with USD/CAD plunging from confluent uptrend resistance at 1.3812/55- a region defined by the 1.618% extension of the 2021 advance and the April 2020 lows. The reversal comes on building daily momentum divergence and the focus heading into October is on possible pullback into the uptrend. Initial support being probed here at the May 2019 high-day close at 1.3515 with a more significant confluence zone eyed around the median-line / 23.6% retracement at 1.3405- look for a larger reaction there IF reached. Initial resistance now back at 1.3651 with a breakout of this formation needed to mark resumption back towards the 1.38 and beyond.
Bottom line: A reversal off uptrend resistance has us looking for a pullback into uptrend support early in the month. Keep in mind we already have a sizeable move in oil prices with US Non-Farm Payrolls (NFP) and Canada employment on tap Friday- stay nimble into the monthly open and watch the weekly close. From at trading standpoint, losses should be limited to the 1.34-handle IF price is indeed heading higher on this stretch. Review my latest USD/CAD Weekly Price Outlook for a closer look at the longer-term Canadian Dollar technical trade levels.
For a complete breakdown of Michael’s trading strategy, review his Foundations of Technical Analysis series on Building a Trading Strategy
-Written by Michael Boutros, Technical Strategist with DailyFX
Follow Michael on Twitter @MBForex


