


Gold Technical Price Forecast: XAU/USD Weekly Trade Levels
- Gold price updated trade levels - Weekly Technical Chart
- XAU/USD recovery testing yearly downtrend resistance- October range breakout pending
- Get started with this Free How to Trade Gold -Beginners Guides
Gold prices are off more than 1.4% this week after XAU/USD attempting to snap a two-week winning streak off fresh multi-year lows. The recovery faltered at yearly downtrend resistance last week and the focus now shifts to an imminent breakout of the October opening-range for guidance. These are the updated targets and invalidation levels that matter on the XAU/USD weekly chart. Review my latest Weekly Strategy Webinar for an in-depth breakdown of this gold technical setup and more.
Gold Price Chart - XAU/USD Weekly
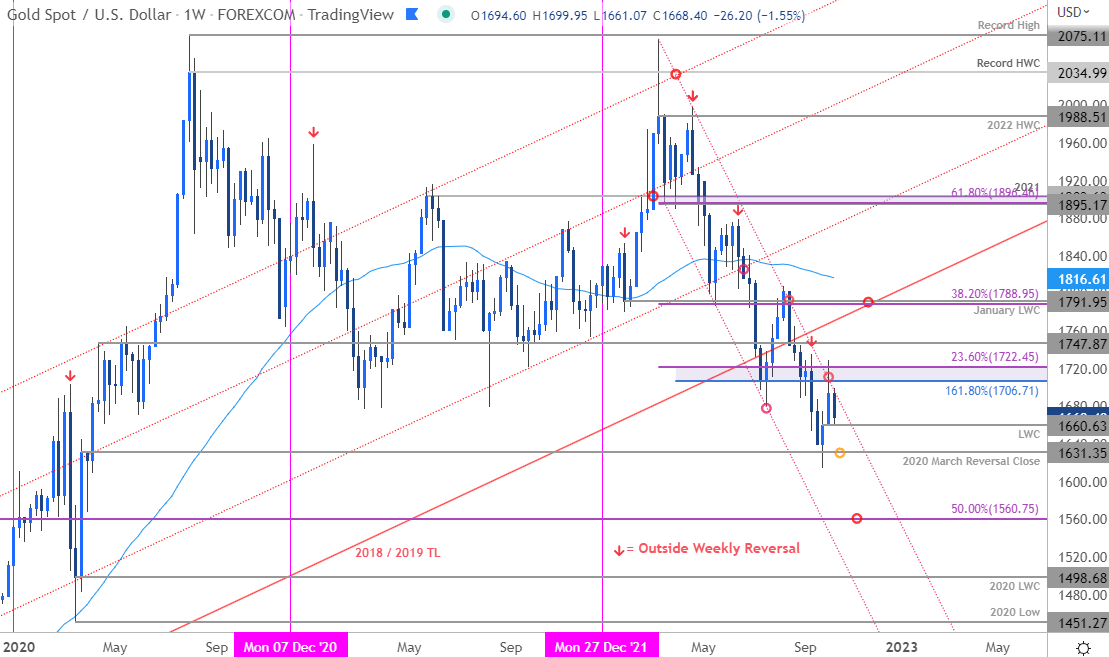
Chart Prepared by Michael Boutros, Technical Strategist; Gold on Tradingview
Notes: In my last Gold Weekly Price Outlook I highlighted support around the 2020 March reversal close at 1631 while noting that XAU/USD had plunged to an intraday at, “1621 before recovering back above 1631- the focus remains on possible inflection off this zone heading into the close of the month / quarter.” Gold rallied more than 7% off the lows with the advance faltering last week at yearly downtrend resistance- the October opening-range is taking shape just below this slope and the immediate focus is on a breakout the days ahead for guidance here.
Weekly resistance is eyed at the 1.618% extension of the decline off the yearly high / 23.6% Fibonacci retracement of the 2022 range at 1706/22 – a breach / weekly close above this threshold is needed to suggest a more significant low was registered last month and that a larger reversal may be underway. Such a scenario would expose the April 2019 high at 1747 and the 38.2% retracement / January low-week close at 1788/91- look for a larger reaction there IF reached. Initial support rests with the low-week close at 1660 with a break / weekly close below 1631 needed to mark resumption of the broader downtrend towards the 50% retracement at 1560.

Bottom line: Gold is carving out the October opening-range just below yearly channel resistance- look to the breakout for short-term direction but with the broader focus on a breakout of the 1631-1722 range for guidance. From a trading standpoint, the next few weeks are absolutely critical for gold with a break of this range likely to fuel the next major leg in price. Stay nimble heading into the close of the week with key inflation data on tap tomorrow likely to spur some added volatility here. Review my latest Gold Price Short-term Technical Outlook for a closer look at the near-term XAU/USD trade levels.
For a complete breakdown of Michael’s trading strategy, review his Foundations of Technical Analysis series on Building a Trading Strategy
Gold Trader Sentiment – XAU/USD Price Chart
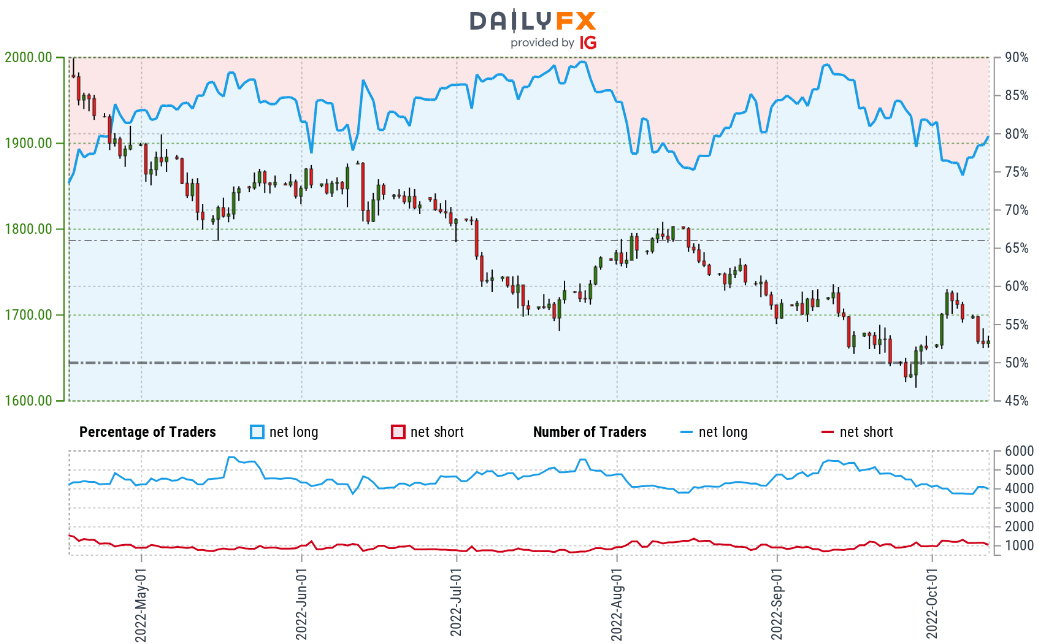
- A summary of IG Client Sentiment shows traders are net-long Gold- the ratio stands at +3.92 (79.66% of traders are long) – typically bearish reading
- Long positions are 0.86% higher than yesterday and 12.99% higher from last week
- Short positions are 12.15% lower than yesterday and 20.36% lower from last week
- We typically take a contrarian view to crowd sentiment, and the fact traders are net-long suggests Gold prices may continue to fall. Traders are further net-long than yesterday and last week, and the combination of current positioning and recent changes gives us a stronger Gold-bearish contrarian trading bias from a sentiment standpoint.
| Change in | Longs | Shorts | OI |
| Daily | 1% | -3% | -1% |
| Weekly | 2% | -8% | -2% |
Economic Calendar
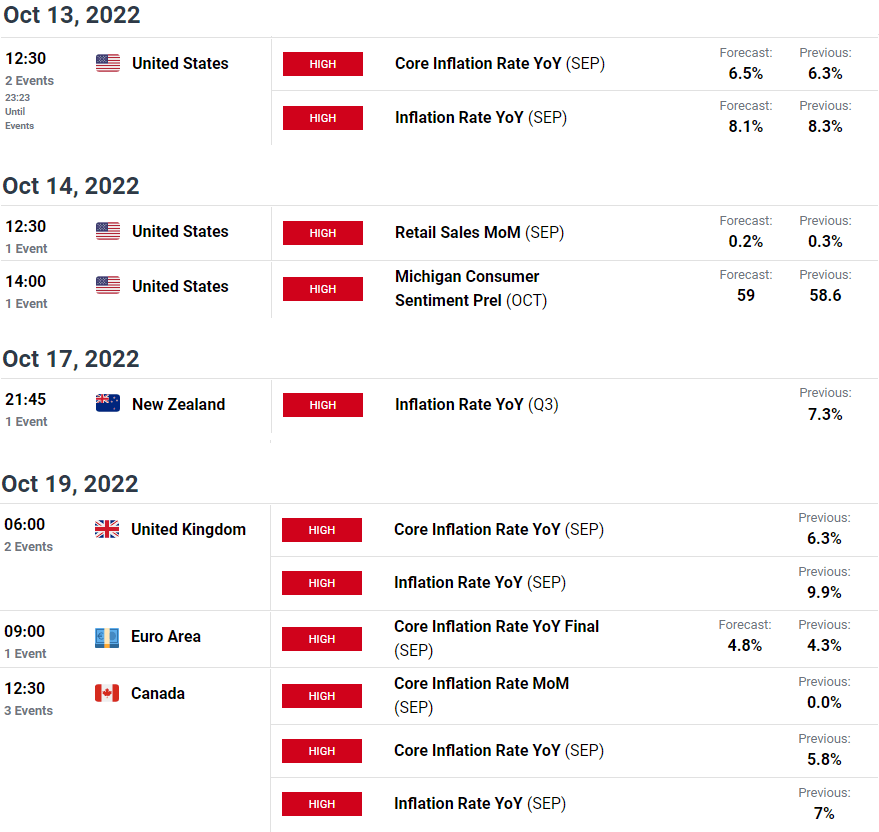
Economic Calendar - latest economic developments and upcoming event risk.
Active Weekly Technical Charts
- S&P 500, Nasdaq & Dow
- US Dollar Index (DXY)
- British Pound (GBP/USD)
- Canadian Dollar (USD/CAD)
- Euro (EUR/USD)
- Crude Oil (WTI)
- Australian Dollar (AUD/USD)
- Japanese Yen (USD/JPY)
- Written by Michael Boutros, Technical Strategist with DailyFX
Follow Michael on Twitter @MBForex


