
Gold, XAU/USD – Outlook:
- XAU/USD fell after minutes of the FOMC meeting in June reinforced expectations of higher interest rates.
- XAU/USD’s slide appears to be losing steam ahead of US jobs data due Friday.
- What are the levels to watch in XAU/USD?

Gold slipped after minutes of the US Federal Reserve’s June meeting kept alive hopes of another rate hike at the end of July.
Minutes of the FOMC meeting showed almost all officials agreed to hold interest rates steady at the June meeting, even though some participants wanted to move ahead with a rate hike. Still, 16 out of 18 officials still expected the benchmark interest rate to rise at least another quarter of a percentage point by the end of the year.
At his semi-annual testimony last month before the House Financial Services Committee and the Senate Banking Committee, Fed chair Powell reiterated the central bank’s hawkish stance saying more rate hikes may be needed. Rates futures are currently showing an 89% chance of a 25 basis points hike at the July 25-26 FOMC meeting, according to the CME FedWatch tool.
XAU/USD 240-minute Chart
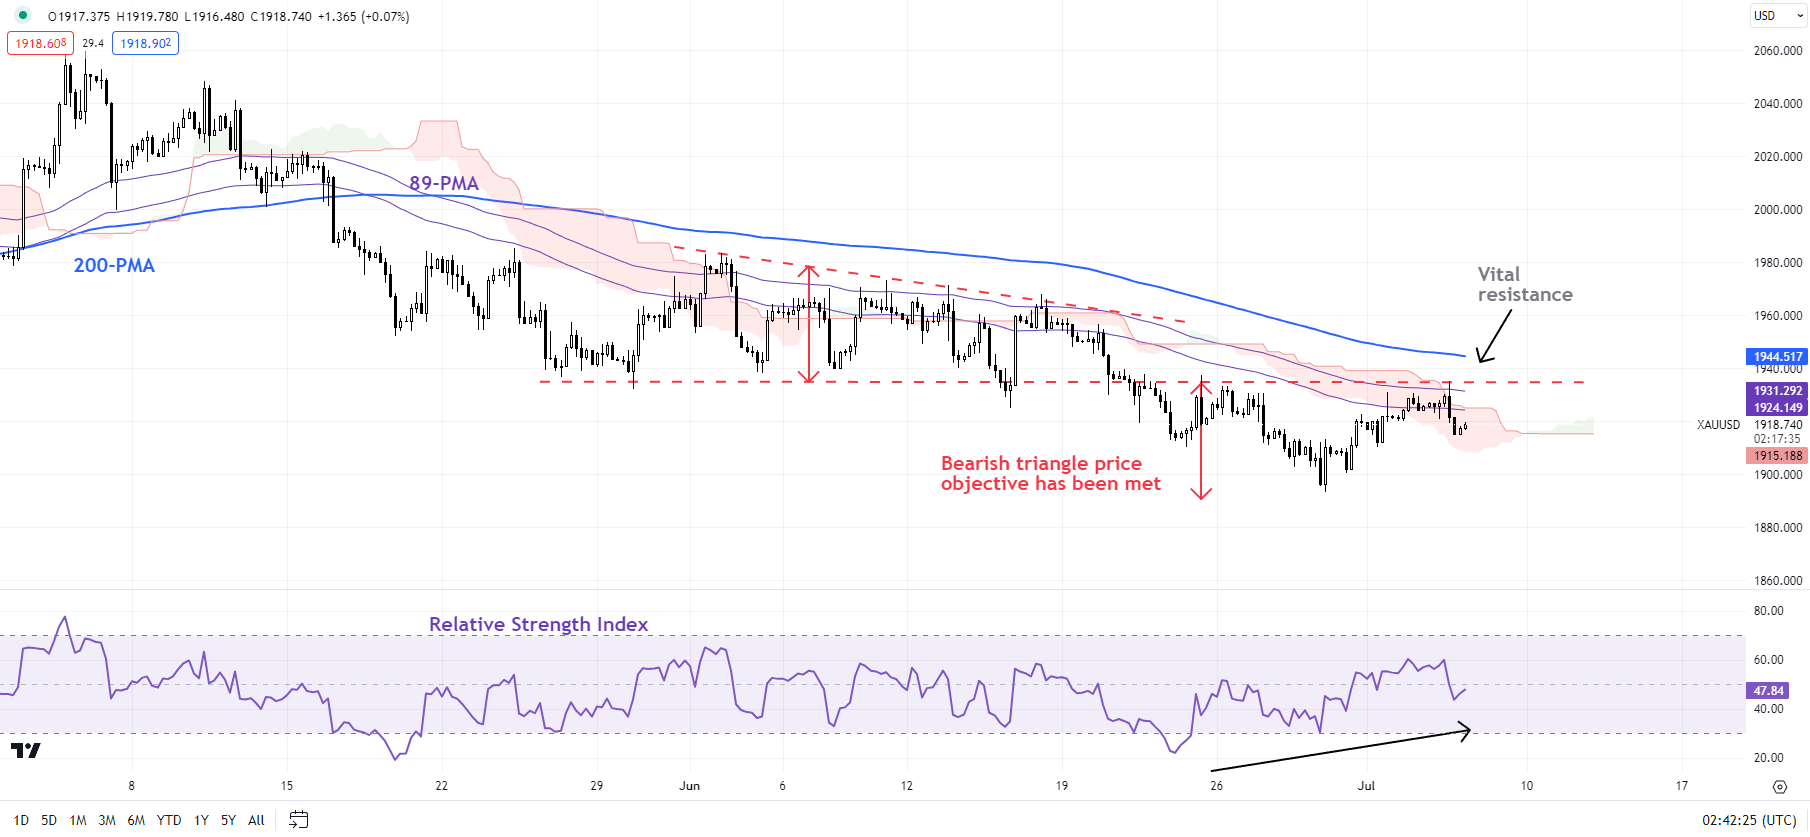
Chart Created by Manish Jaradi Using TradingView
Key focus is now on US jobs data due on Friday: non-farm payrolls are expected to have grown 225k in June, down from 339k in May, but the unemployment rate is expected to have eased to 3.6% from 3.7%. Better-than-expected jobs data could cement expectations for a Fed rate hike later this month, weighing on gold.
On technical charts, XAU/USD has met the price objective of a bearish triangle triggered in late June. On the 240-minute chart, a positive momentum divergence (falling price associated with rising 14-period Relative Strength Index) indicates that the slide is losing steam somewhat. However, as the accompanying chart shows, moving averages continue to point down, reinforcing the bearish bias.
XAU/USD Daily Chart
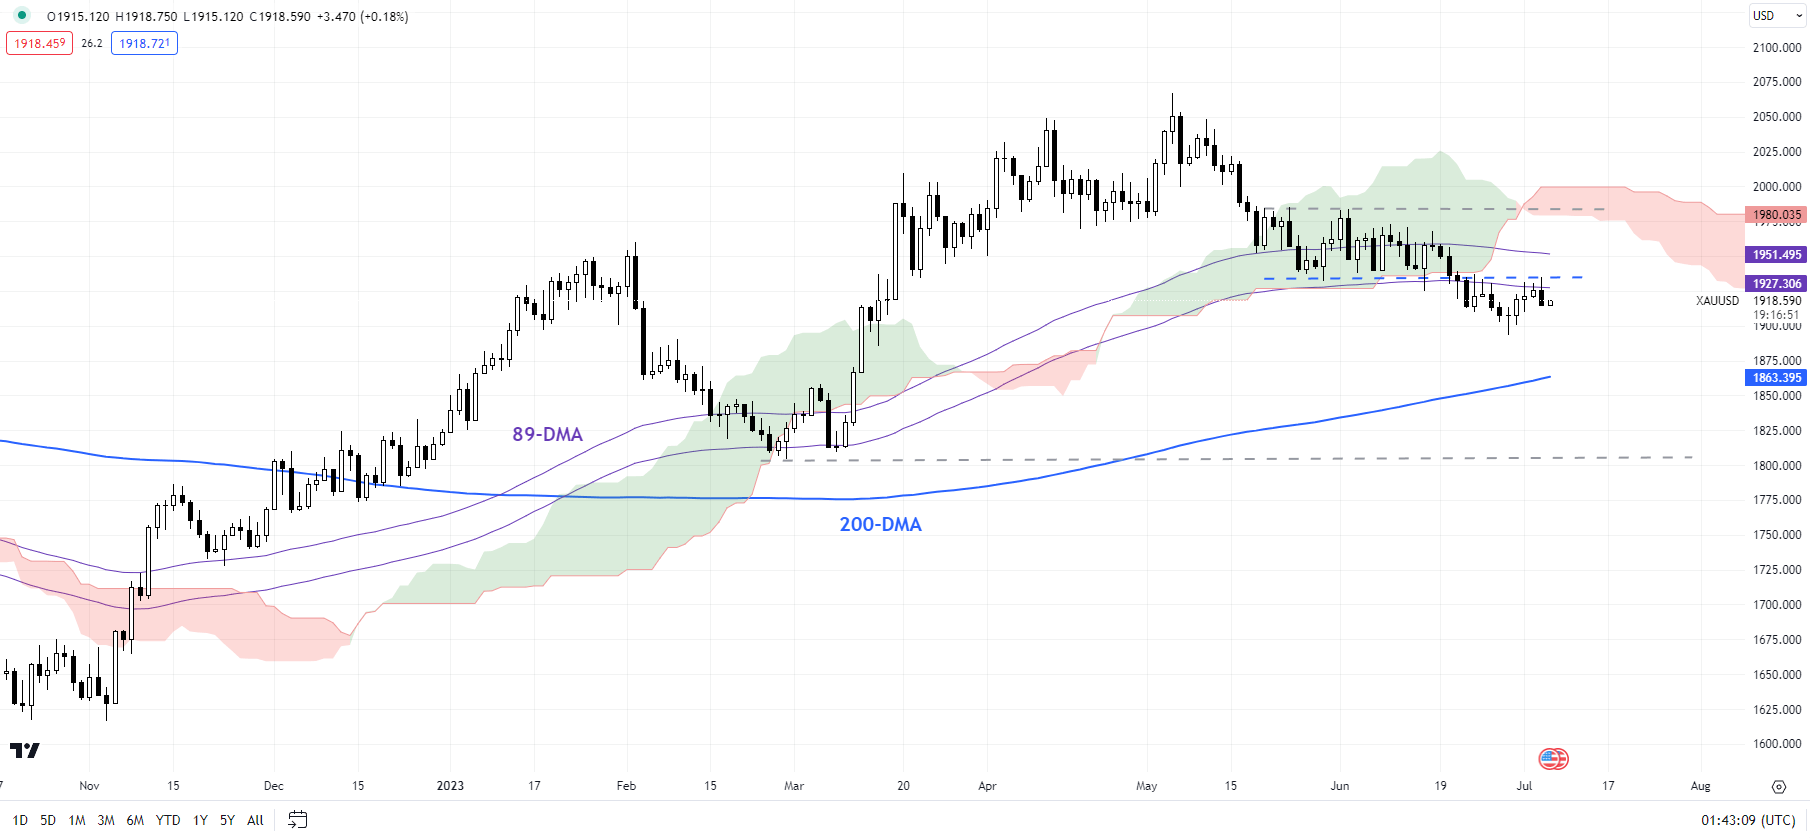
Chart Created by Manish Jaradi Using TradingView
For the immediate downward pressure to ease, gold would need to break above the initial resistance area 1935-1945 (including the end-June high, the 89-period moving average, and the 200-period moving average on the 240-minute charts). Any break above could open the way toward the early-June high of 1983.
In recent months, the yellow metal has been showing signs of fatigue, particularly on higher timeframe charts. See “Gold Could Find It Tough to Crack $2000”,published March 28, and “Gold Weekly Forecast: Is it Time to Turn Cautious on XAU/USD?” published April 16. Subsequent updates can be found here:April 24,May 10,May 17, May 31, June 8, andJune 22.
Trade Smarter - Sign up for the DailyFX Newsletter
Receive timely and compelling market commentary from the DailyFX team
--- Written by Manish Jaradi, Strategist for DailyFX.com
--- Contact and follow Jaradi on Twitter: @JaradiManish