Skip to Content
News & Analysis at your fingertips.

We use a range of cookies to give you the best possible browsing experience. By continuing to use this website, you agree to our use of cookies.
You can learn more about our cookie policy here, or by following the link at the bottom of any page on our site. See our updated Privacy Policy here.

Free Trading Guides
Subscribe
Please try again
Select

Live Webinar Events

0

Economic Calendar Events

0

Notify me about

Live Webinar Events
Economic Calendar Events

H

High

M

Medium

L

Low
More View More
FTSE 100 Makes yet Another Record High while DAX and S&P 500 Rally is Slowing Down

FTSE 100 Makes yet Another Record High while DAX and S&P 500 Rally is Slowing Down

Axel Rudolph, IG Senior Market Analyst

Share:

What's on this page

FTSE 100, DAX 40, S&P 500 Analysis and Charts

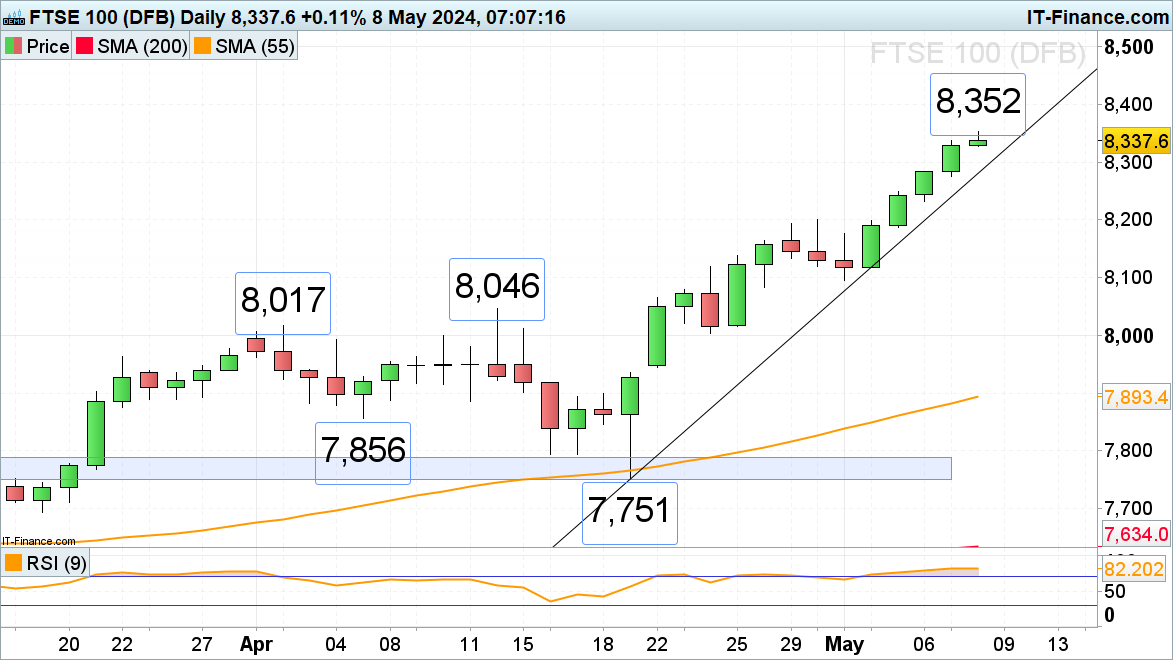
​​​FTSE 100 hits yet another record high

​The FTSE 100 has so far seen four straight days of gains with each making a new record high ahead of this morning’s, the fifth day in a row around the 8,350 mark. Further up beckons the 8,500 region.

​The tentative April-to-May uptrend line at 8,280 offers support.

FTSEDaily Price Chart

FTSE 100 Bearish
Data provided by
of clients are net long. of clients are net short.
Change in Longs Shorts OI
Daily 3% -2% -1%
Weekly 48% -4% 3%
What does it mean for price action?
Get My Guide

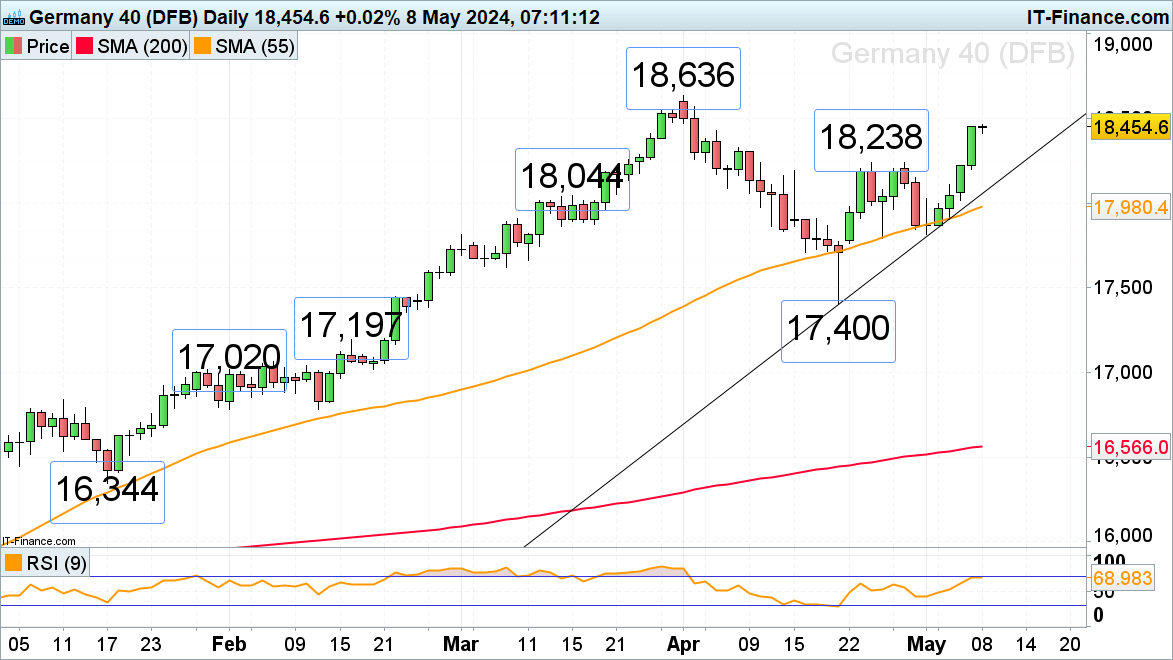
DAX 40 trades at a one-month high

​The DAX 40 has seen four straight days of gains take it to a one-month high around the 18,450 level with the April record high at 18,636 representing the next upside target.

​Potential slips should find good support between the 24 and 29 April highs at 18,240 and 18,238.

DAXDaily Chart

Recommended by Axel Rudolph
The Fundamentals of Range Trading
The Fundamentals of Breakout Trading
The Fundamentals of Trend Trading
Recommended by Axel Rudolph
Master The Three Market Conditions
Get My Guides

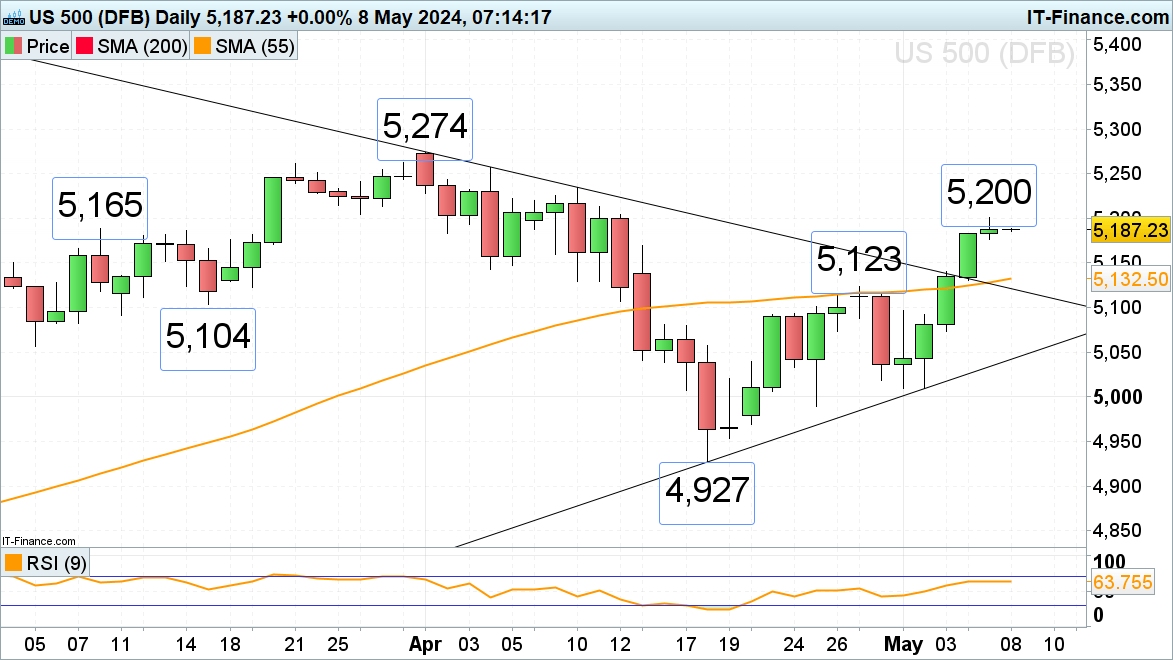
S&P 500 sees five straight days of gains

​The S&P 500’s 3.5% rally from its early May low amid five consecutive days of gains has taken it to the 5,200 mark around which it may short-term lose upside momentum. A slip towards the 5,132 to 5,123 55-day simple moving average (SMA) and the late April high might be on the cards for this week.

​Were the recent advance to continue, the April record high at 5,274 would be back in the frame.

S&P 500 Daily Chart

DailyFX provides forex news and technical analysis on the trends that influence the global currency markets.

DISCLOSURES