


Gold (XAU/USD) - Analyst Pick - Short-Term Negative Outlook
Gold’s correction lower continues with the precious metal currently unable to break through a recent cluster of highs around $2,335/oz. level. Gold has broken below support from a short-term bearish flag formation and remains under the short-term, 20-day, simple moving average, adding to the short-term negative bias. To move higher, gold needs to break, and open, above the 20-dsma at $2,337/oz.
Initial support for the precious metal comes off the 23.6% Fibonacci retracement level at $2,884/oz. ahead of a recent level of support just below at $2,280/oz. If this level is broken convincingly, then the 50-day sma, currently at $2,255/oz. comes into focus, before big figure support at $2,200/oz. and the 38.2% Fibonacci retracement level at $2,193/oz. The latter level should provide a reasonable level of support and stem any further move lower.
Learn How to Trade Gold with our Expert Guide:

Gold Daily Price Chart
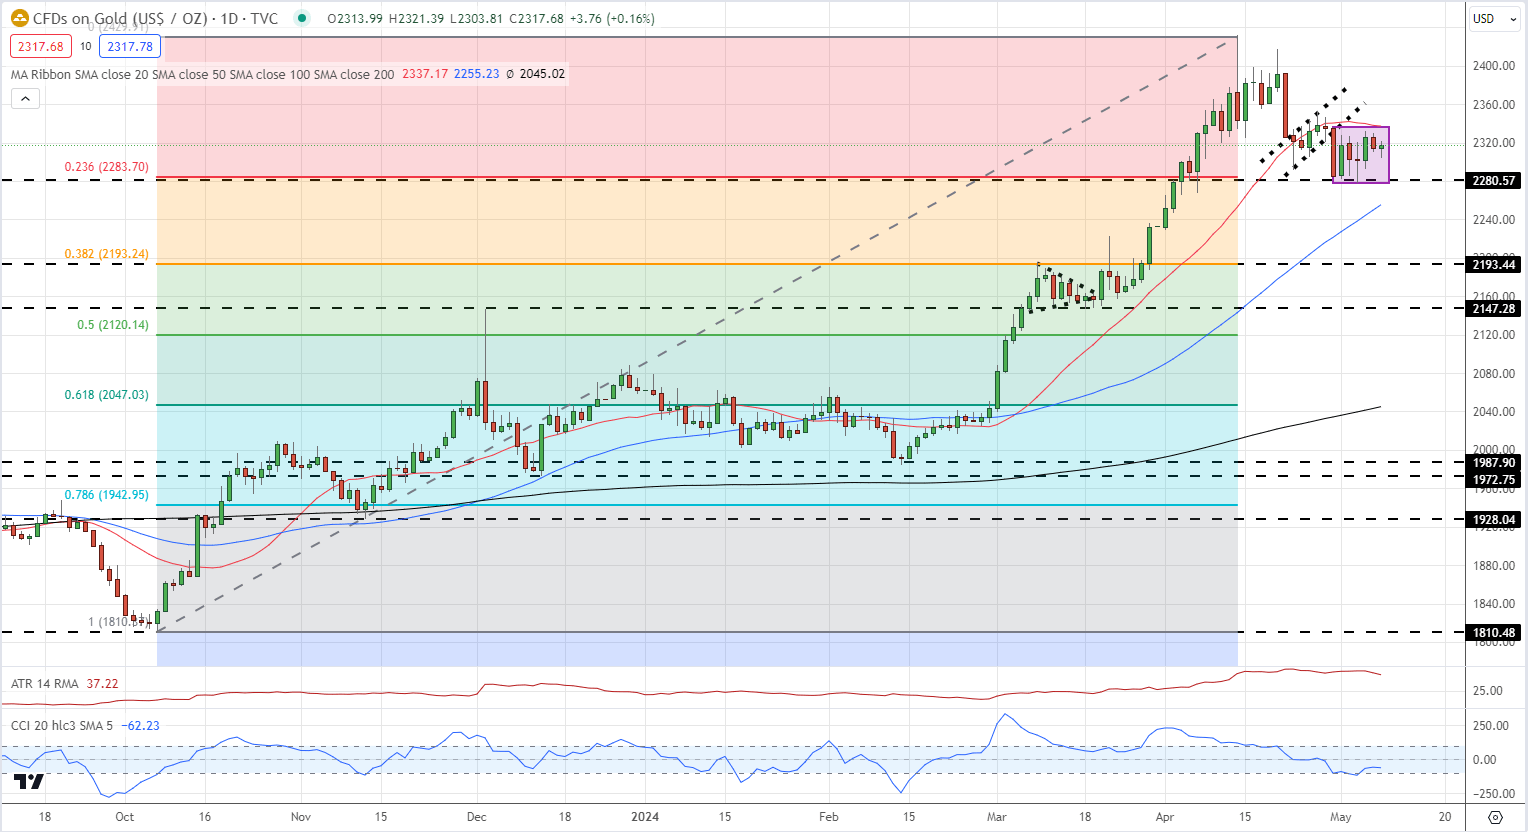
Chart via TradingView
Gold – Mixed Retail Outlook, Contrarian View Hints at Potential Price Drop
Retail trader data shows 58.56% of traders are net-long with the ratio of traders long to short at 1.41 to 1.The number of traders net-long is 6.70% higher than yesterday and 1.28% lower than last week, while the number of traders net-short is 9.13% lower than yesterday and 0.39% lower than last week.
We typically take a contrarian view to crowd sentiment, and the fact traders are net-long suggests Gold prices may continue to fall. Positioning is more net-long than yesterday but less net-long from last week. The combination of current sentiment and recent changes gives us a further mixed Gold trading bias
| Change in | Longs | Shorts | OI |
| Daily | 1% | -3% | -1% |
| Weekly | 2% | -8% | -2% |
What is your view on Gold – bullish or bearish?? You can let us know via the form at the end of this piece or contact the author via Twitter @nickcawley1.


