


Gold, XAU/USD - Technical Outlook:
- Gold’s rally is showing signs of fatigue.
- $2000 is quite strong psychological and technical resistance.
- What are the key levels to watch?

GOLD TECHNICAL OUTLOOK - NEUTRAL
Gold could find it tough to break above the key psychological $2000 as risk appetite appears to be stabilizing.
First Citizens BancShares takeover of a large part of Silicon Valley Bank, UBS’ move to acquire Credit Suisse, and the willingness of regulators to provide liquidity/backstop facilities have provided comfort to investors that the worst banking shock since the Great Financial Crisis would be contained.
XAU/USD Daily Chart
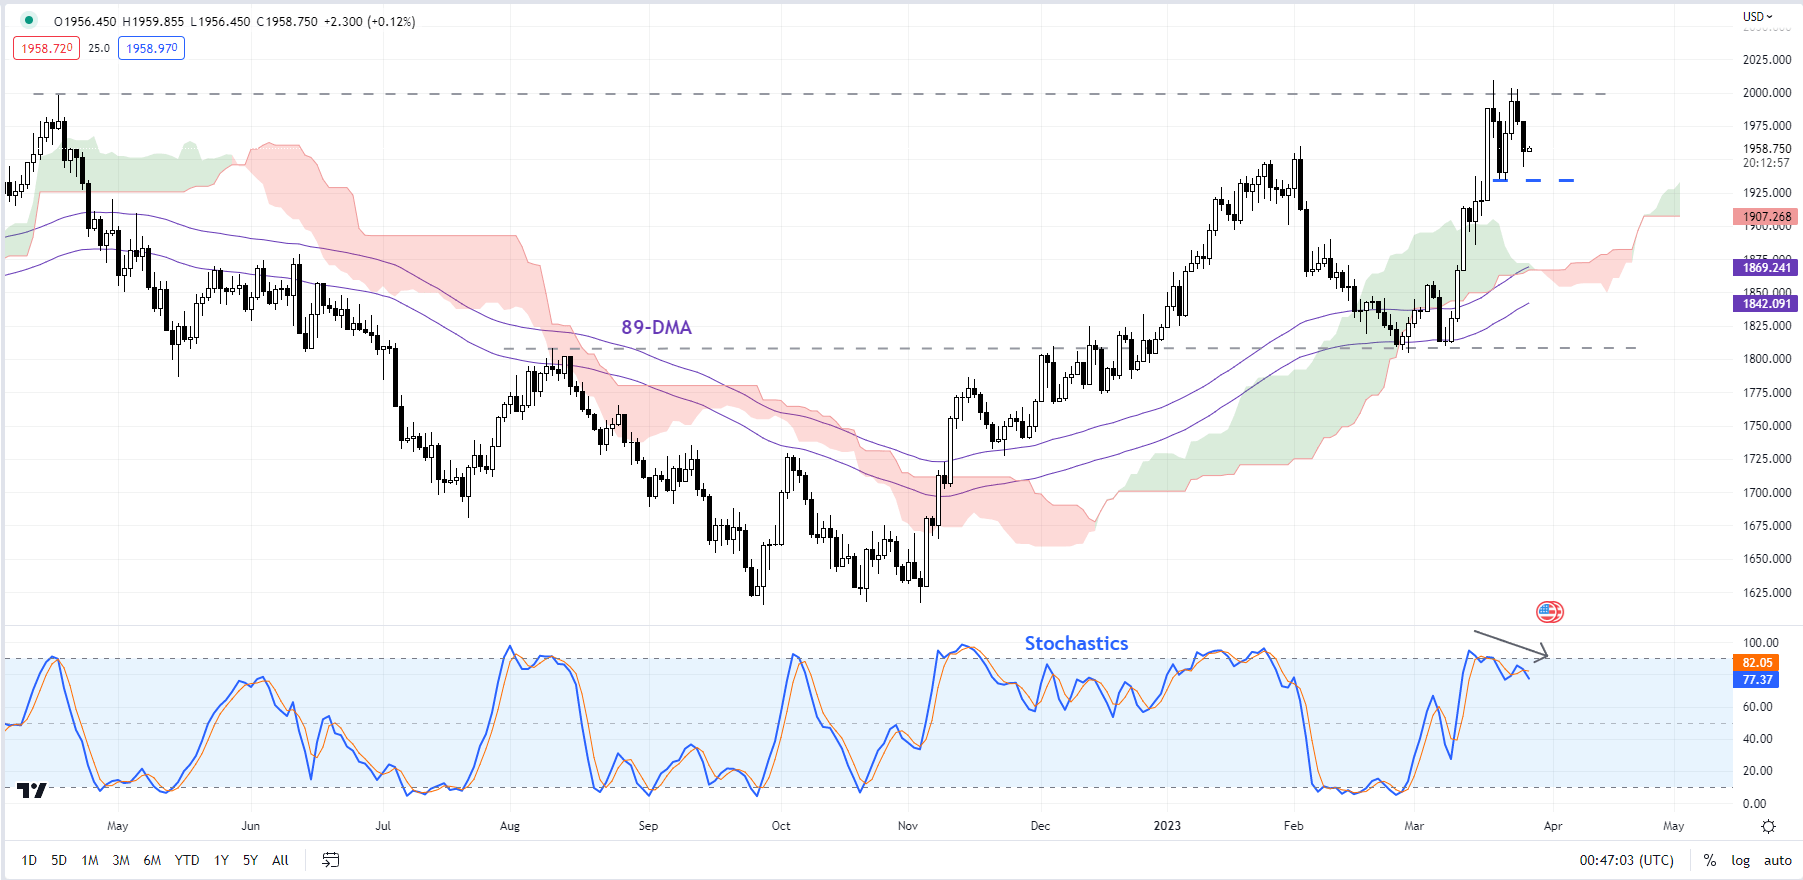
Chart Created Using TradingView
XAU/USD has risen over 10% since the end of February as worries regarding the global financial sector have overshadowed still-strong US data (US Economic Surprise is at a fresh 10-month high), boosting the safe-haven appeal of the yellow metal. Moreover, expectations of a sooner-than-expected pause in the US Fed rate hiking cycle have weighed on US yields, supporting the non-interest-bearing asset.
XAU/USD Weekly Chart
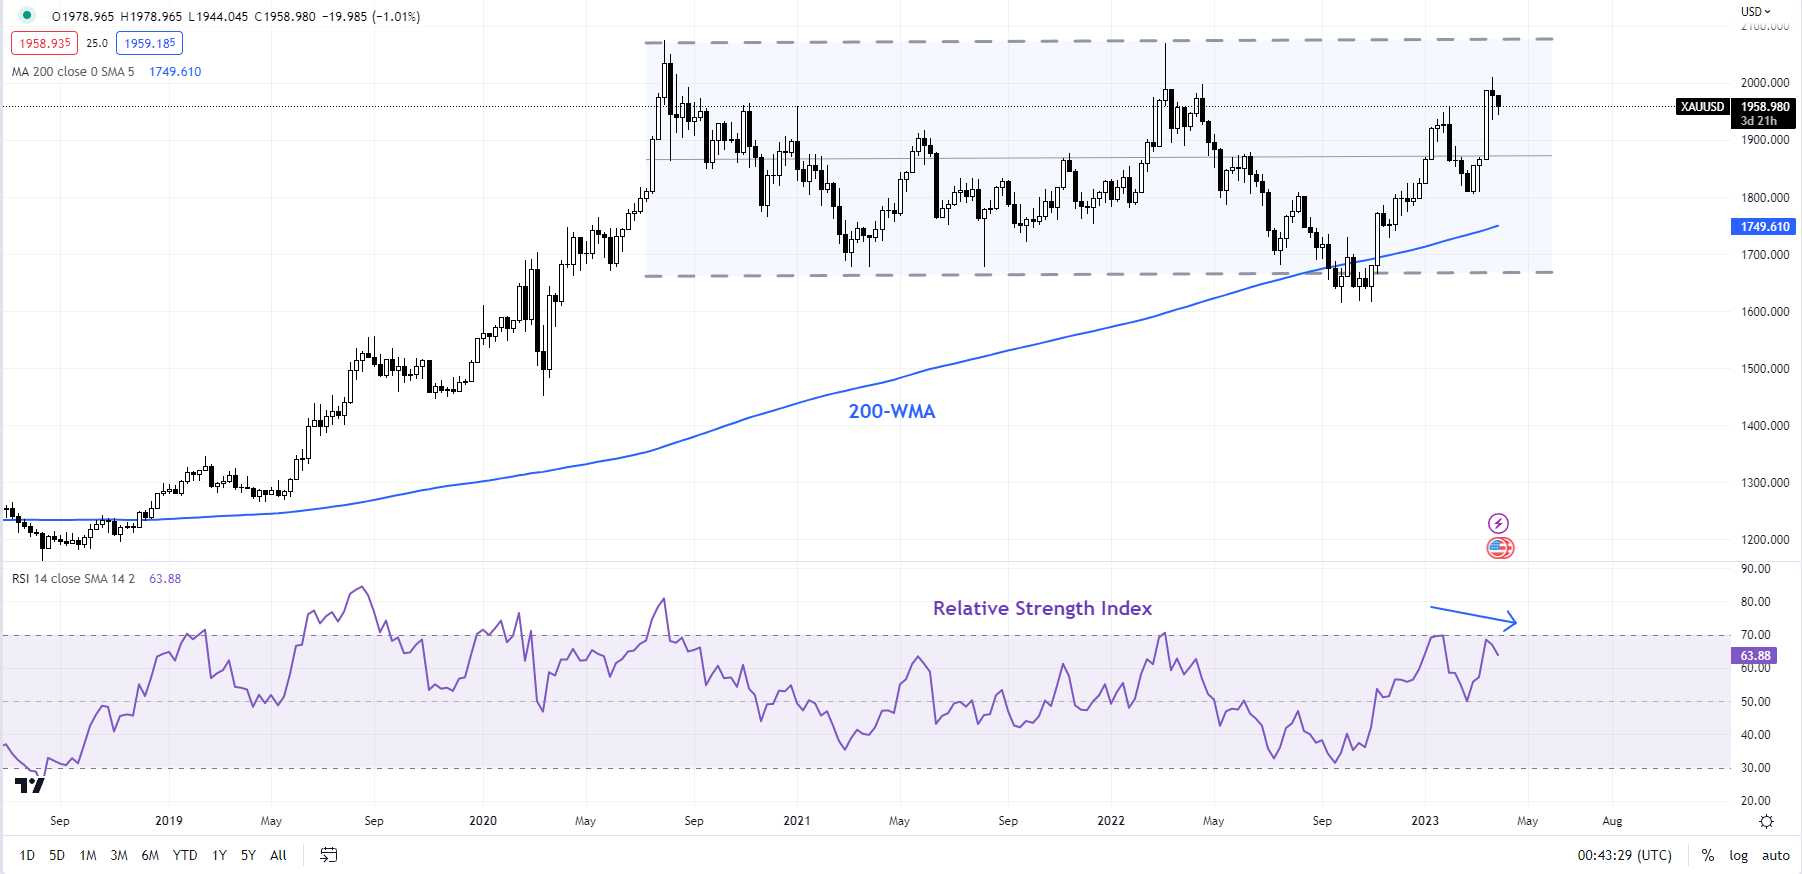
Chart Created Using TradingView
The key focus is now on US Core PCE Price Index for February due on Friday, which is expected flat at 4.7% on-year. A stronger-than-expected print could dent expectations regarding a Fed rate cut. Last week, the Fed indicated it was on the verge of pausing further rate hikes, prompting markets to price in a rate cut as early as Q3-2023.
On technical charts, a negative divergence on the daily and weekly charts indicates XAU/USD’s rally is showing signs of fatigue as it tests crucial psychological and technical resistance (including the April 2022 high) at 2000. To be sure, a retreat isn’t imminent.
XAU/USD 240-minute Chart
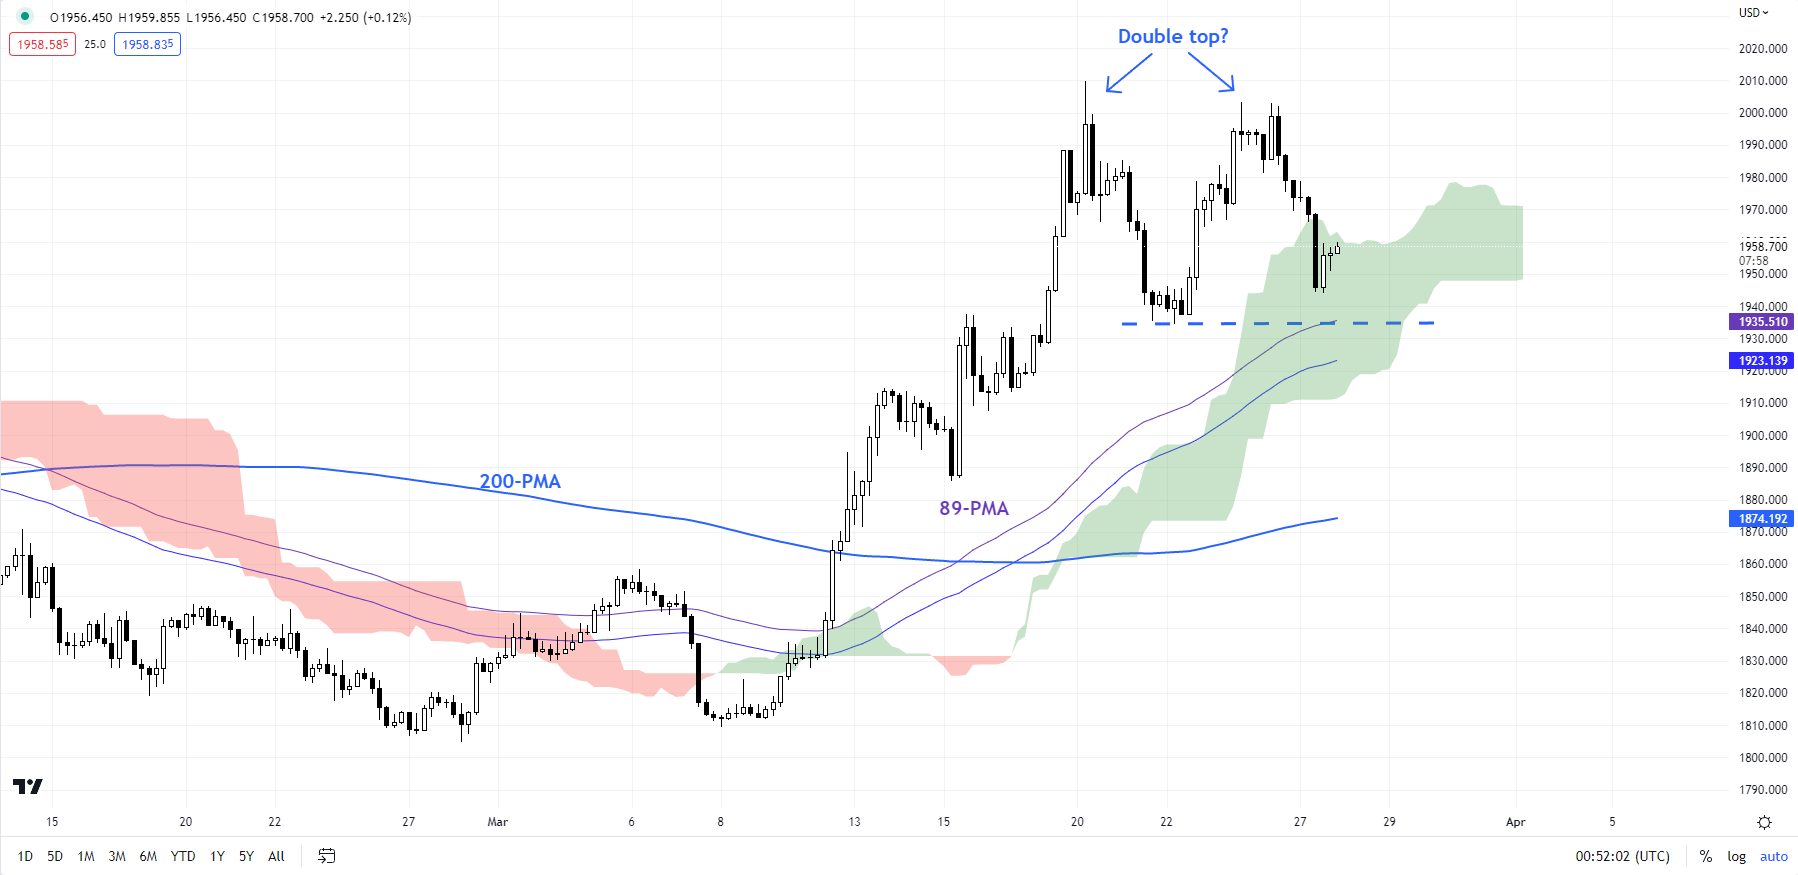
Chart Created Using TradingView
Any break below immediate support at the mid-March low of 1934 would confirm that the upward pressure had faded in the interim. Such a break would trigger a minor double top (the late-March highs), opening the way toward 1875.
Gold’s sharp rebound came about from near-strong support at the end-February low of 1804, coinciding with the 89-day moving average. See “Gold Technical Outlook: A Turnaround on the Cards?”, published March 1.
Trade Smarter - Sign up for the DailyFX Newsletter
Receive timely and compelling market commentary from the DailyFX team
--- Written by Manish Jaradi, Strategist for DailyFX.com
--- Contact and follow Jaradi on Twitter: @JaradiManish


