


Gold, XAU/USD - Technical Setup:
- Gold has rebounded from near quite strong support.
- The broader picture remains constructive for the yellow metal.
- What are the key levels to watch?

Tuesday’s rebound could be a tentative signal that the month-long slide in precious metals is losing steam. However, the yellow metal has some more work to do before it is out of the woods.
Gold recouped some losses after US consumer confidence unexpectedly fell in February and China’s manufacturing activity expanded at the fastest pace in more than a decade. Notwithstanding softer consumer confidence on Tuesday, US data has been broadly better than expected since the start of the month, as reflected in the Economic Surprise Index which is around its highest level since April. As a result, rate futures are pricing in the Fed’s target rate to peak around 5.42% in September from the current 4.50-4.75%, compared with under 5% at the end of January. Higher interest rates increase the opportunity cost of holding the non-yielding asset, weighing on gold prices.
XAU/USD Daily Chart
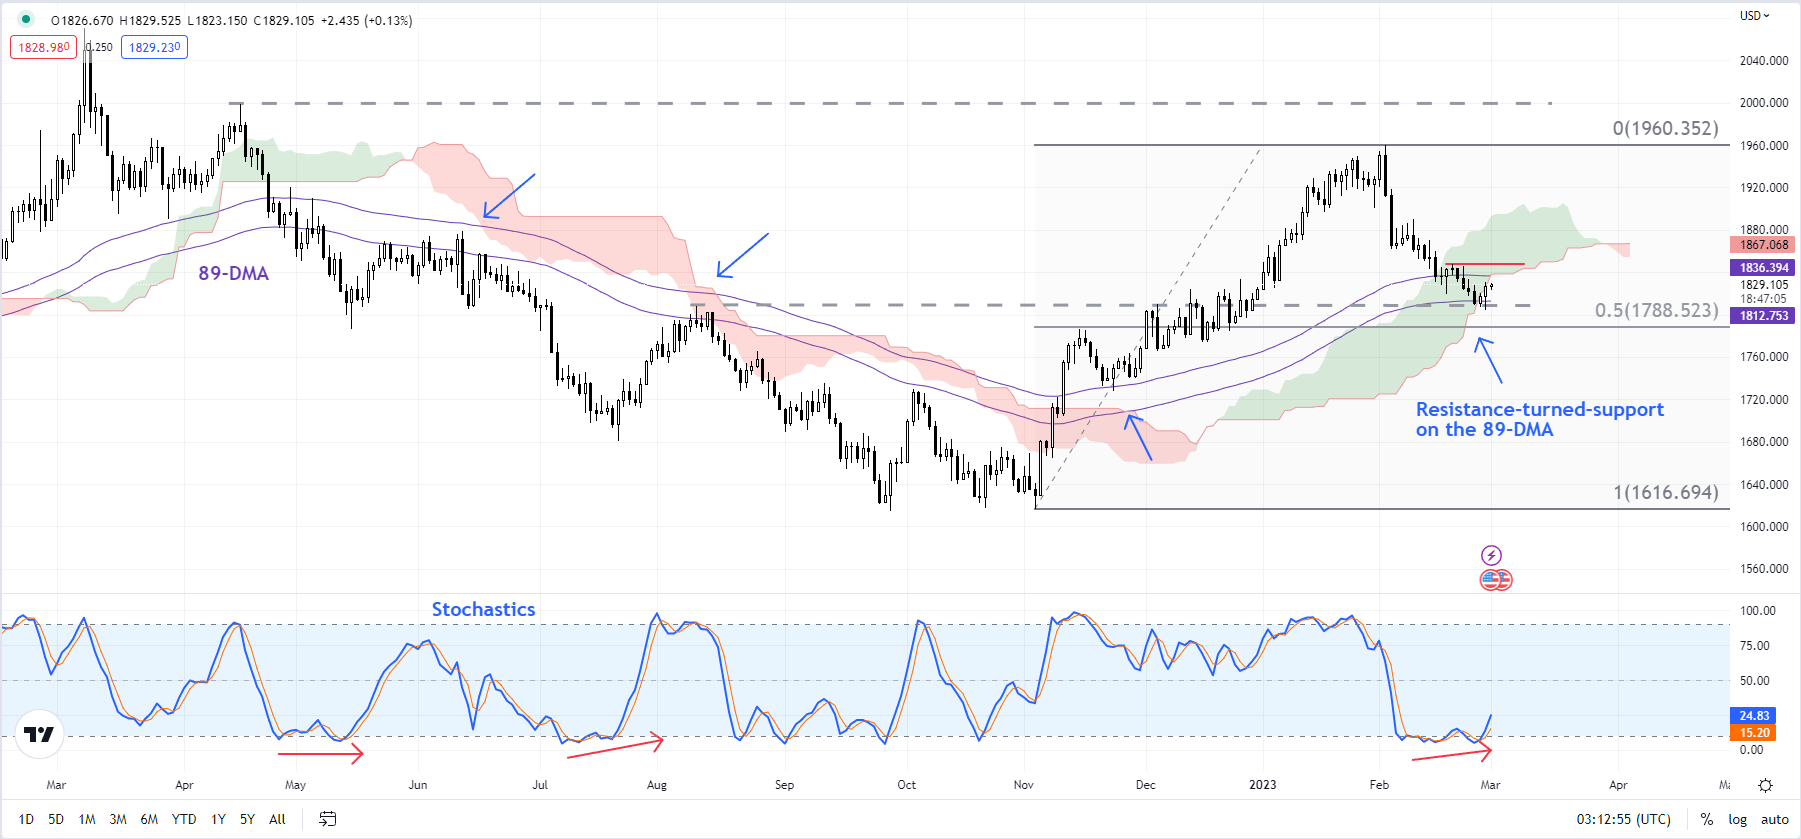
Chart Created Using TradingView
Meanwhile, on technical charts, gold is attempting to rebound from the near quite strong converged support area of 1775-1810: the August high of 1807, the lower edge of the Ichimoku cloud support on the daily charts, the 200-day moving average, and the resistance-turned-support on the 89-day moving average. Positive momentum divergence – lower gold prices associated with a stalling in momentum – indicates that the downward pressure could be fading. For more on the short-term trend, see “Gold and Silver Technical Outlook: Have Precious Metals Turned Bearish?”, published Feb.13.
XAU/USD 240-minute Chart

Chart Created Using TradingView
On the upside, Tuesday’s rise has brought gold toward a tough converged ceiling of 1835-1850: the upper edge of a declining channel from early February, the February 22 high of 1848, the 89-period moving average, and the upper edge of the Ichimoku cloud on the 240-minute chart. If Tuesday’s rebound is for real, then gold needs to break above the 1835-1850 zone.Until then, the path of least resistance remains sideways to down.
Zooming out, the broader trend in gold continues to be up while it holds above 1775-1810. However, as noted in the previous update “Gold Price Action Setup: Deciphering the Trend”, published February 22, the absence of a significant price pivot on the daily charts above the August high of 1808 makes it tricky.
Trade Smarter - Sign up for the DailyFX Newsletter
Receive timely and compelling market commentary from the DailyFX team
--- Written by Manish Jaradi, Strategist for DailyFX.com


