


Gold, XAU/USD – Price Action:
- Gold’s trend remains up, notwithstanding the recent slowdown in the pace of gains.
- Key focus is on US CPI data due later today.
- Which way for gold and what are the key levels to watch in XAU/USD?

Gold remains lofty as US debt ceiling talks continue ahead of key US inflation data later Wednesday. With no sign of reversal of the uptrend on technical charts, the balance of risks is tilted toward the upside. However, if price pressures rise at a faster clip, the focus could shift to key support levels given the dismal momentum on higher timeframe charts.
Core inflation measures, including CPI, PCE, and PPI, suggest inflationary pressures are moderating, but still well above the US Federal Reserve’s 2% target. In this regard, US CPI index data due later today will shed some more light – the core CPI is expected to have eased to 5.5% on-year in April from 5.6% in March. Headline CPI is expected to remain steady at 5% on-year.
US Consumer Price Index
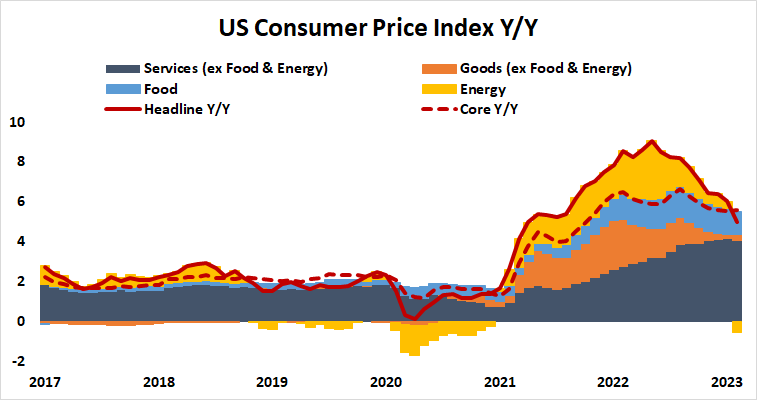
Source data: Bloomberg; Chart prepared in Microsoft Excel
The Fed last week raised interest rates by 25 bps as expected but indicated a pause in the hiking cycle. Markets are currently pricing in 75 basis points of rate cuts by the end of the year, according to CME’s FedWatch tool. If the CPI data suggest price pressures rose faster than expected last month, it could lead to a reassessment of Fed rate cut expectations, especially after Friday’s stronger-than-expected US jobs data.
XAU/USD Daily Chart
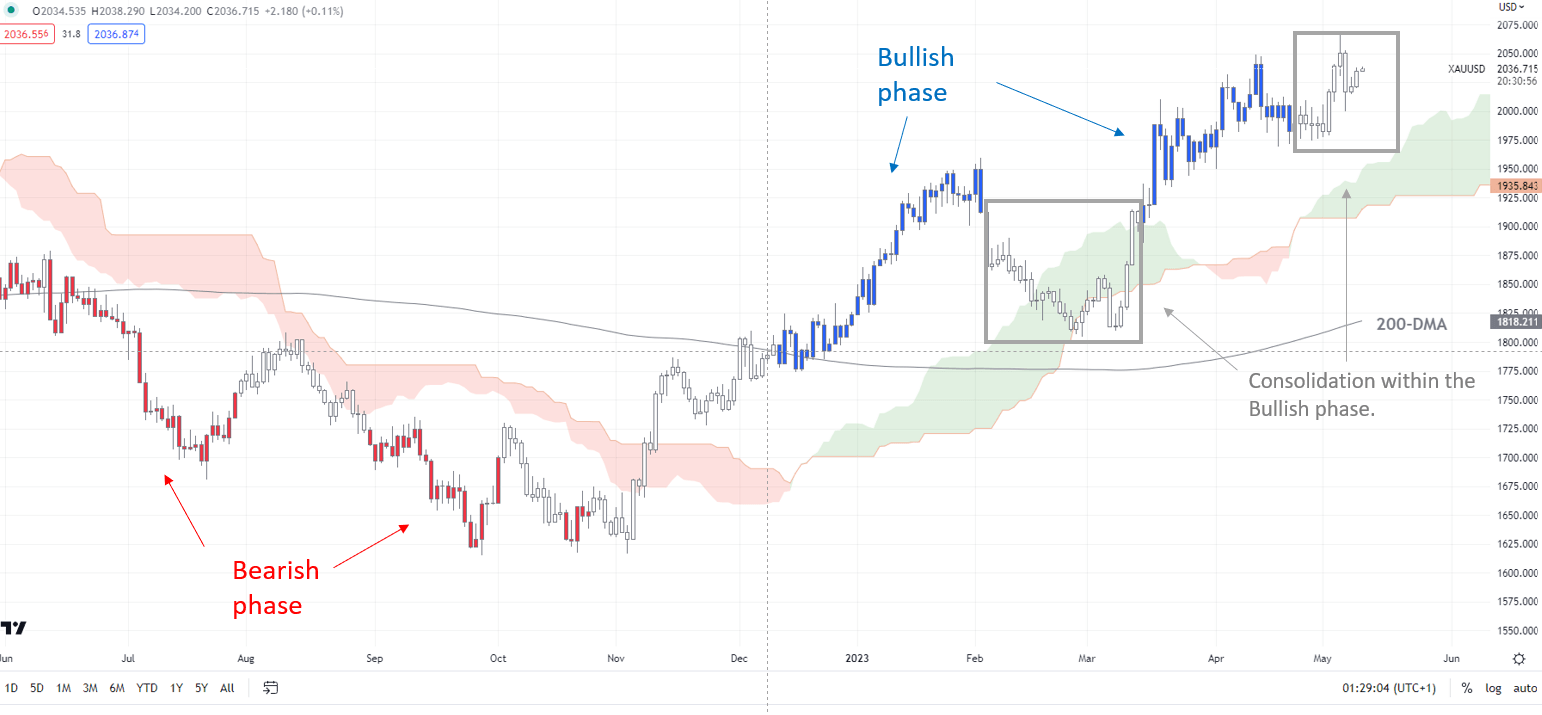
Chart Created by Manish Jaradi Using TradingView
Note: In the above colour-coded chart, Blue candles represent a Bullish phase. Red candles represent a Bearish phase. Grey candles serve as Consolidation phases (within a Bullish or a Bearish phase), but sometimes they tend to form at the end of a trend. Note: Candle colors are not predictive – they merely state what the current trend is. Indeed, the candle color can change in the next bar. False patterns can occur around the 200-period moving average, or around a support/resistance and/or in sideways/choppy market. The author does not guarantee the accuracy of the information. Past performance is not indicative of future performance. Users of the information do so at their own risk.
Any uptick in price pressures could boost US Treasury yields and the US dollar and weigh on gold. In contrast, further moderation in price pressures could weigh on yields and the US dollar, pushing gold toward the 2020 record high of 2072.
XAU/USD Weekly Chart
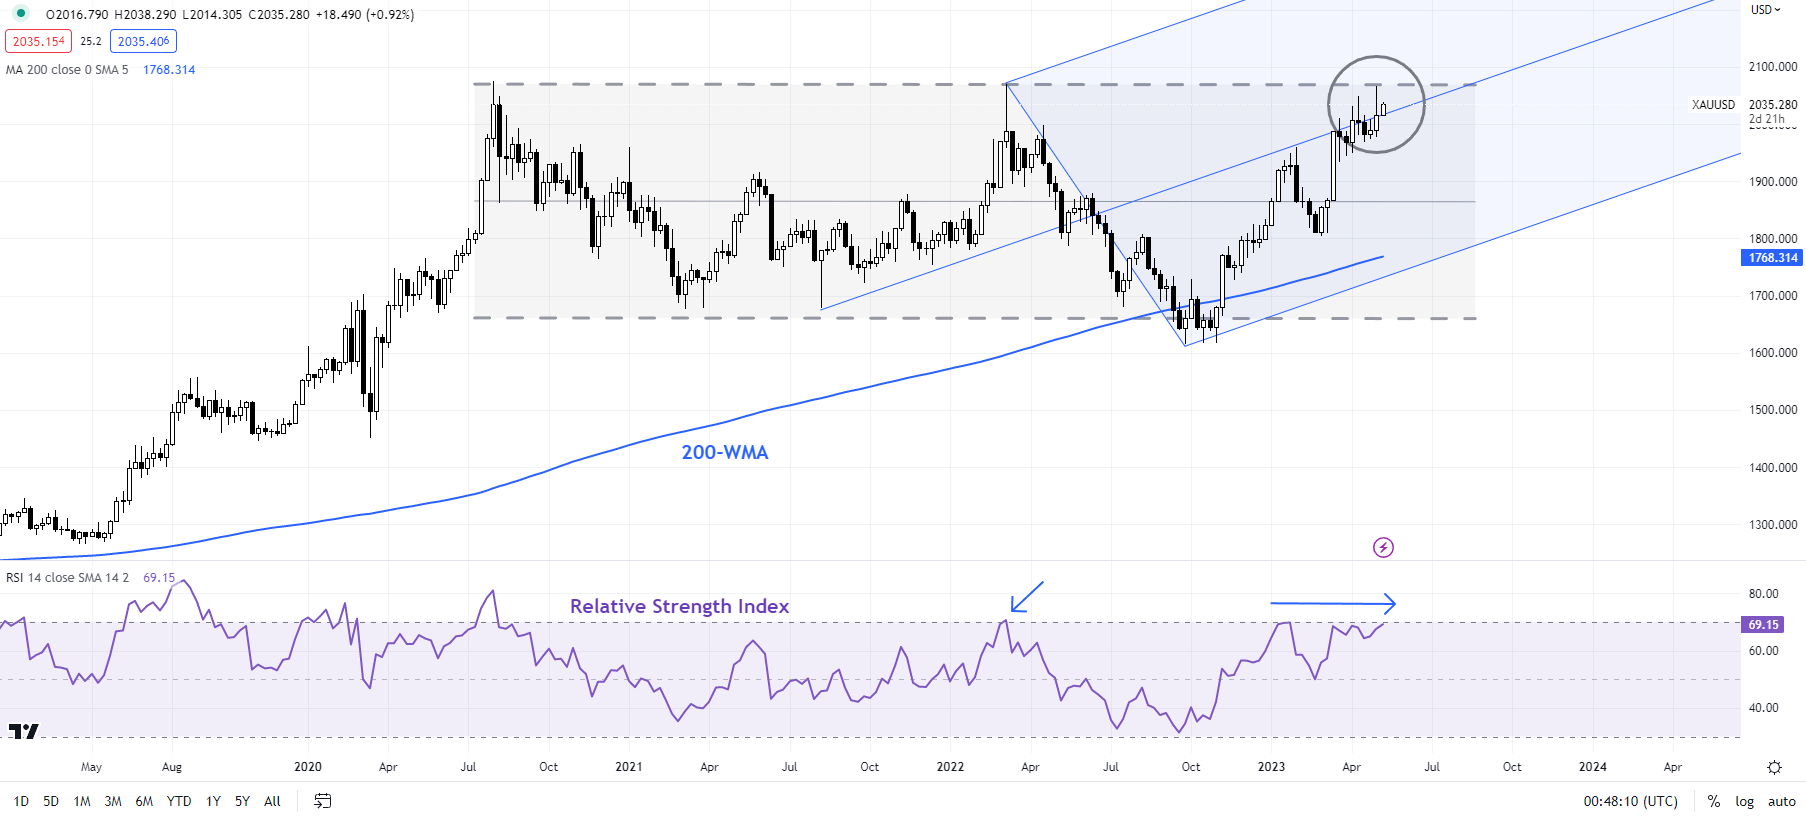
Chart Created by Manish Jaradi Using TradingView
Much would also depend on how the US debt ceiling talks progress, keeping the safe-haven bids intact in gold in the meantime. A failure to raise the $31.4 trillion federal debt limit would cause a huge hit to the US economy and weaken the dollar as the world’s reserve currency, US Treasury Secretary Janet Yellen said on Monday.
XAU/USD 240-minutes Chart
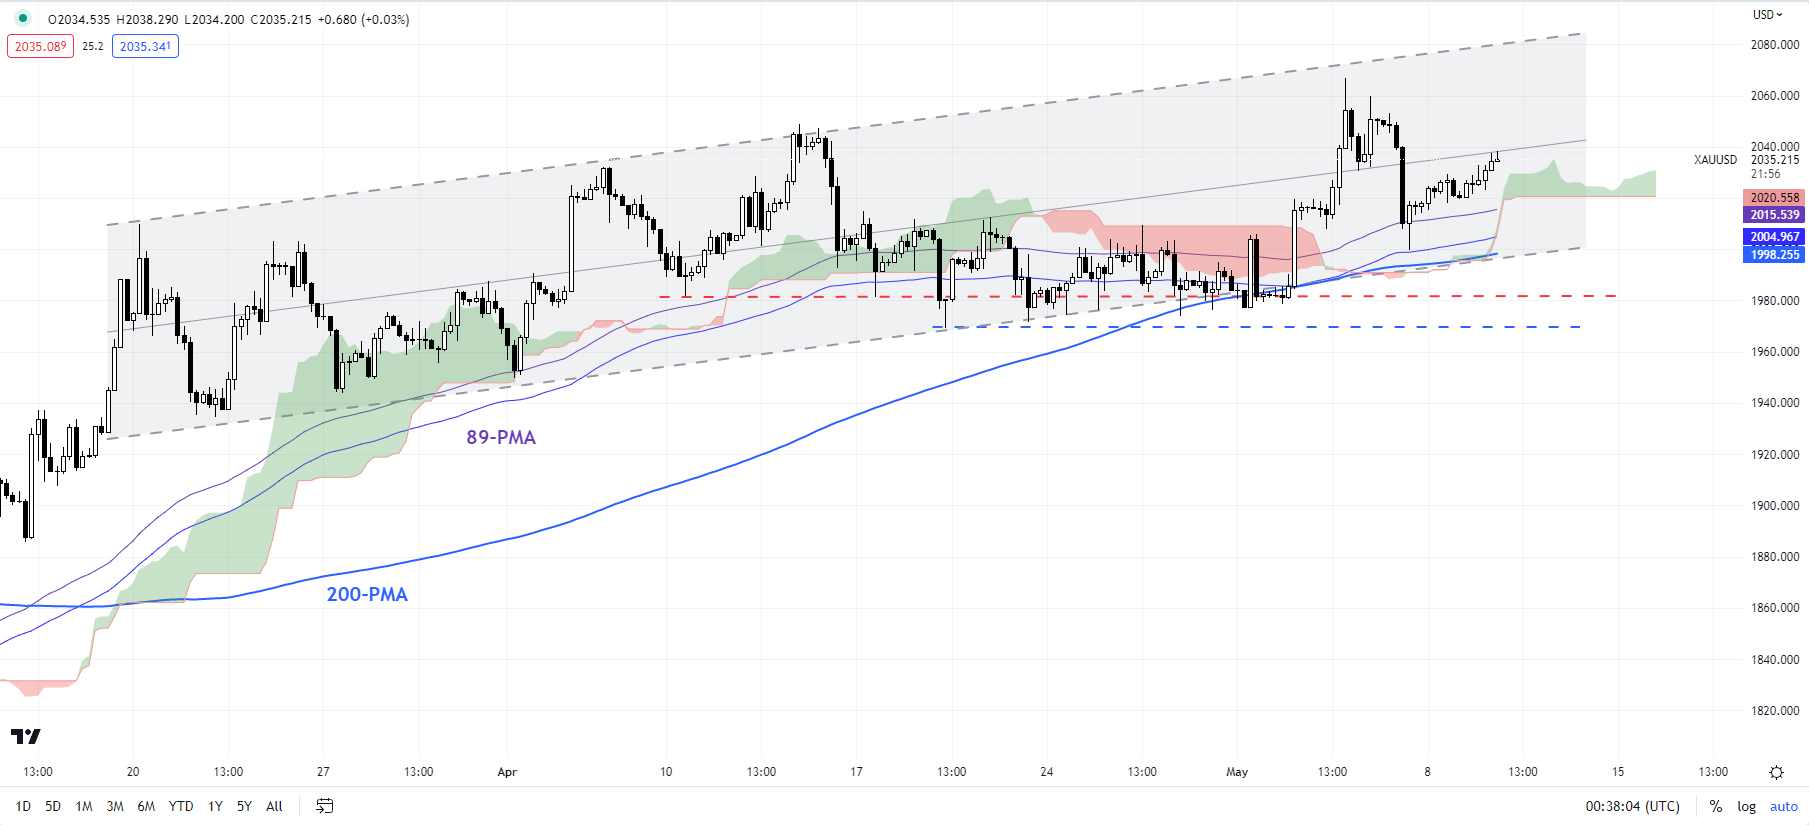
Chart Created by Manish Jaradi Using TradingView
Meanwhile, the trend on the daily technical charts has been up since the end of 2022 as the colour-coded candlestick charts, based on trending/momentum indicators, show. While the gains have slowed recently, XAU/USD hasn’t broken any vital support on 4-hourly charts. There is quite a bit of cushion around 1970-2000, including the 200-period moving average and a horizontal trendline from mid-April at about 1970.
XAU/USD Monthly Chart
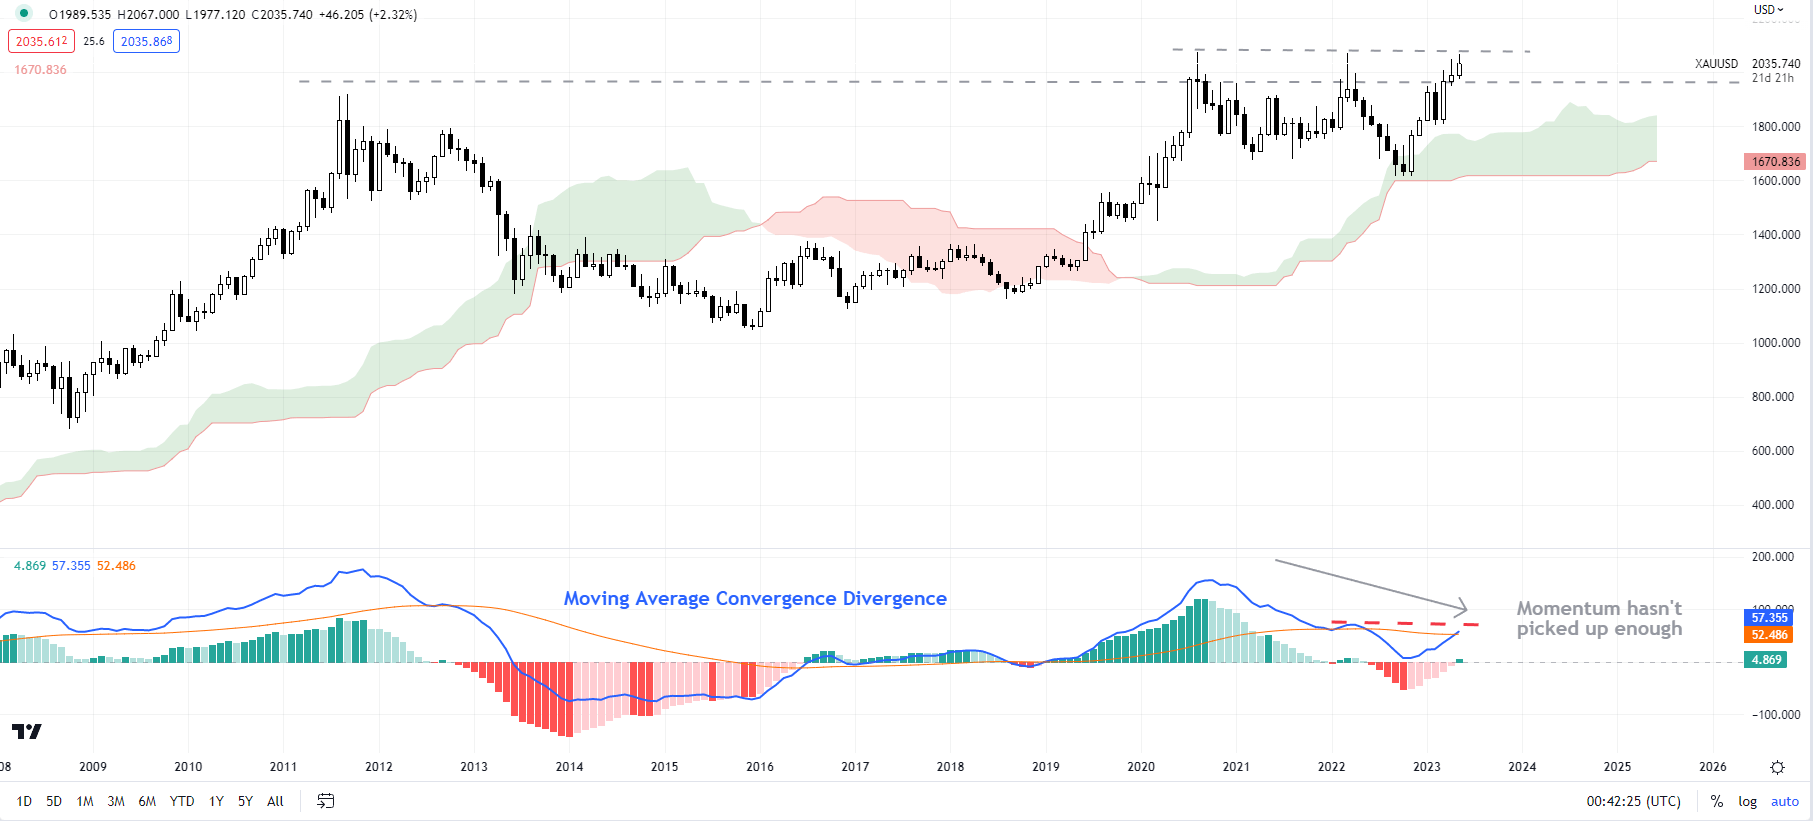
Chart Created by Manish Jaradi Using TradingView
While there are no signs of a reversal of the uptrend, the evolution on higher timeframe charts warrants some attention, as highlighted in recent updates (seeMarch 28,April 16, and April 24). Granted, the price action is still unfolding, the momentum on the monthly charts so far hasn’t reflected the strength in gold prices. A key sign to watch would be if the Moving Average Convergence Divergence indicator (MACD) makes a higher high (see the dotted trendline in red on the monthly chart). Such a development would alleviate some of the concerns.
A spurt in upward momentum could push XAU/USD above the 2020 record high of 2072, potentially toward 2250 (the 61.8% projection of the 2015-2020 swing).

--- Written by Manish Jaradi, Strategist for DailyFX.com
--- Contact and follow Jaradi on Twitter: @JaradiManish


