


Gold, XAU/USD - Weekly Forecast:
- Short-term upward momentum in gold remains strong.
- The yellow metal appears set to test major hurdle at 2069-2072.
- What are the factors and levels to watch out for?

GOLD TECHNICAL OUTLOOK - NEUTRAL
Gold’s rise to a new 13-month high reaffirms that the near-term trend remains up on hopes that the US Federal Reserve is nearing the end of the tightening cycle. The yellow metal is now approaching one of the strongest resistance levels that it has faced in months.
US macro data in recent weeks have been underwhelming, as reflected in the Economic Surprise Index which has fallen sharply since the end of March. Last week, US producer prices unexpectedly declined in March, solidifying the view that broader price pressures are subsiding (see inflation chart). This followed a subdued US CPI report on Wednesday and the dovish tone of the minutes of the FOMC meeting in March, boosting hopes that the Fed is nearing a pause in its rate-hiking campaign. Markets are pricing in about a 34% chance that the Fed will pause at its May meeting, according to the CME’s FedWatch tool.
US inflation measures
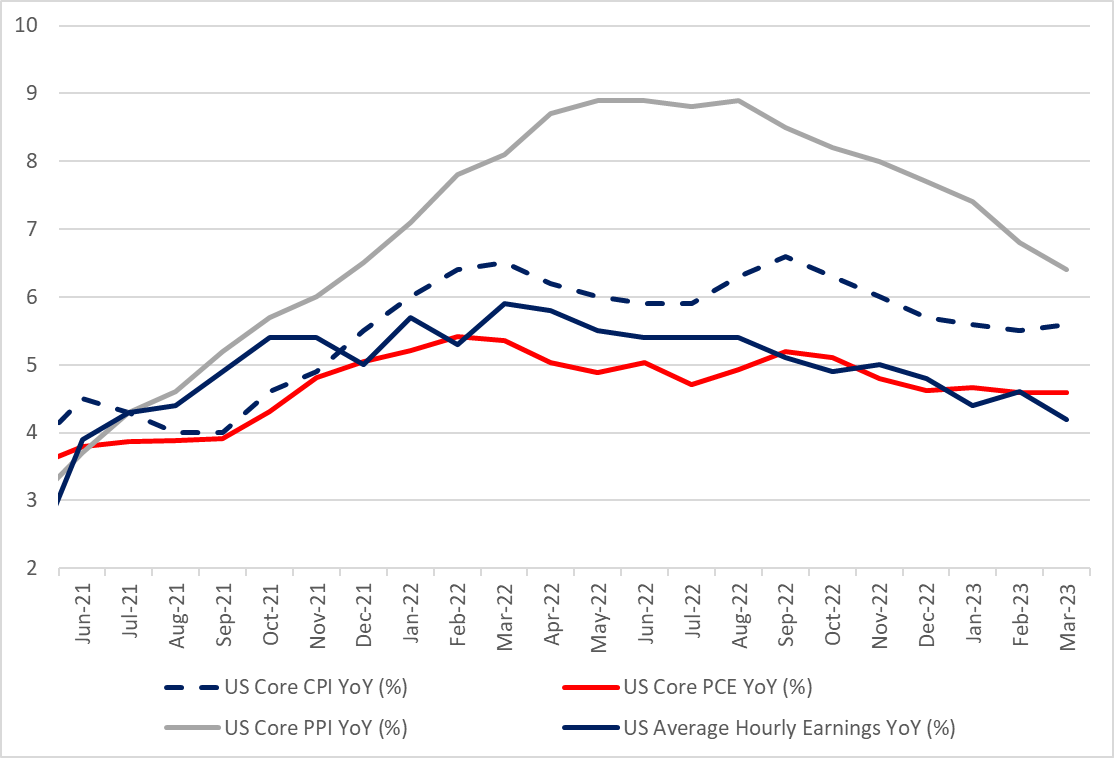
Chart Created by Manish Jaradi; Source data: Bloomberg
In recent weeks, gold has been boosted by safe-haven bids amid the turmoil in the banking sector and the growing view that US policy rates are about to pivot. Expectations of lower policy rates combined with still-elevated inflation (at least above the Fed’s 2% target) would imply lower real rates and higher gold prices (as gold is inversely related to real interest rates). As a result, speculative positioning in gold has increased.
XAU/USD Monthly Chart
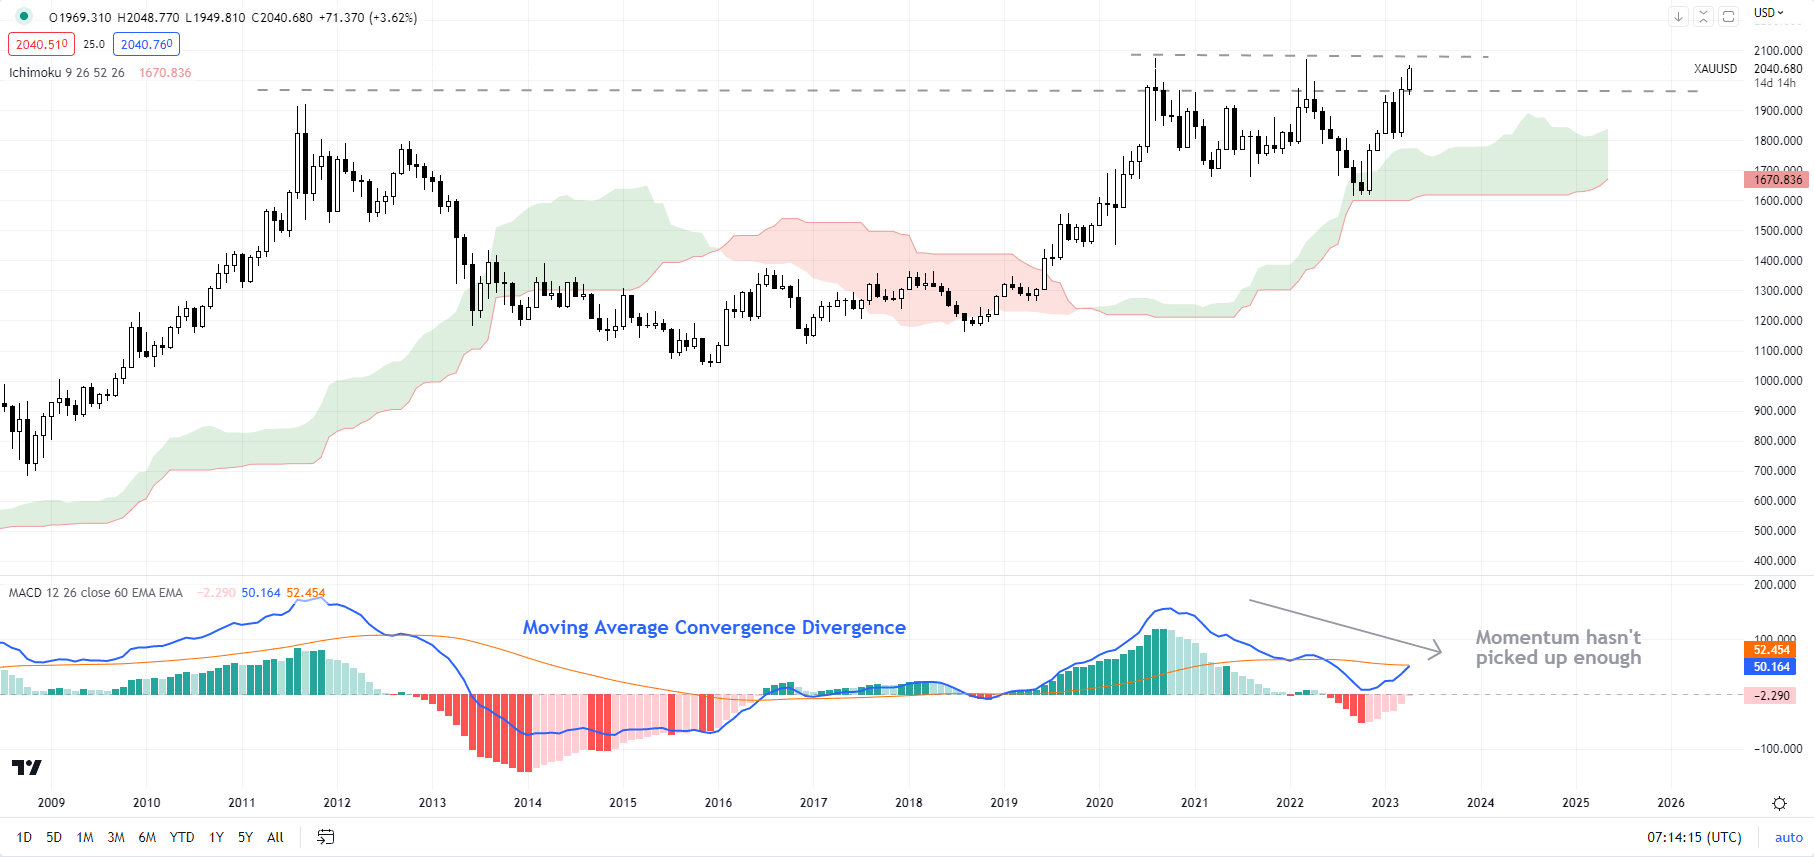
Chart Created Using TradingView
On technical charts, gold is approaching the 2020 and the 2022 highs of 2069-2072. As noted in the previous update, momentum on higher timeframe charts hasn’t picked up to the extent of the rise in gold prices (see the monthly chart). See “Gold Jumps After ISM Data; Can it Rise Above the Key $2000 Level?”, published April 4.
XAU/USD 240-minute Chart
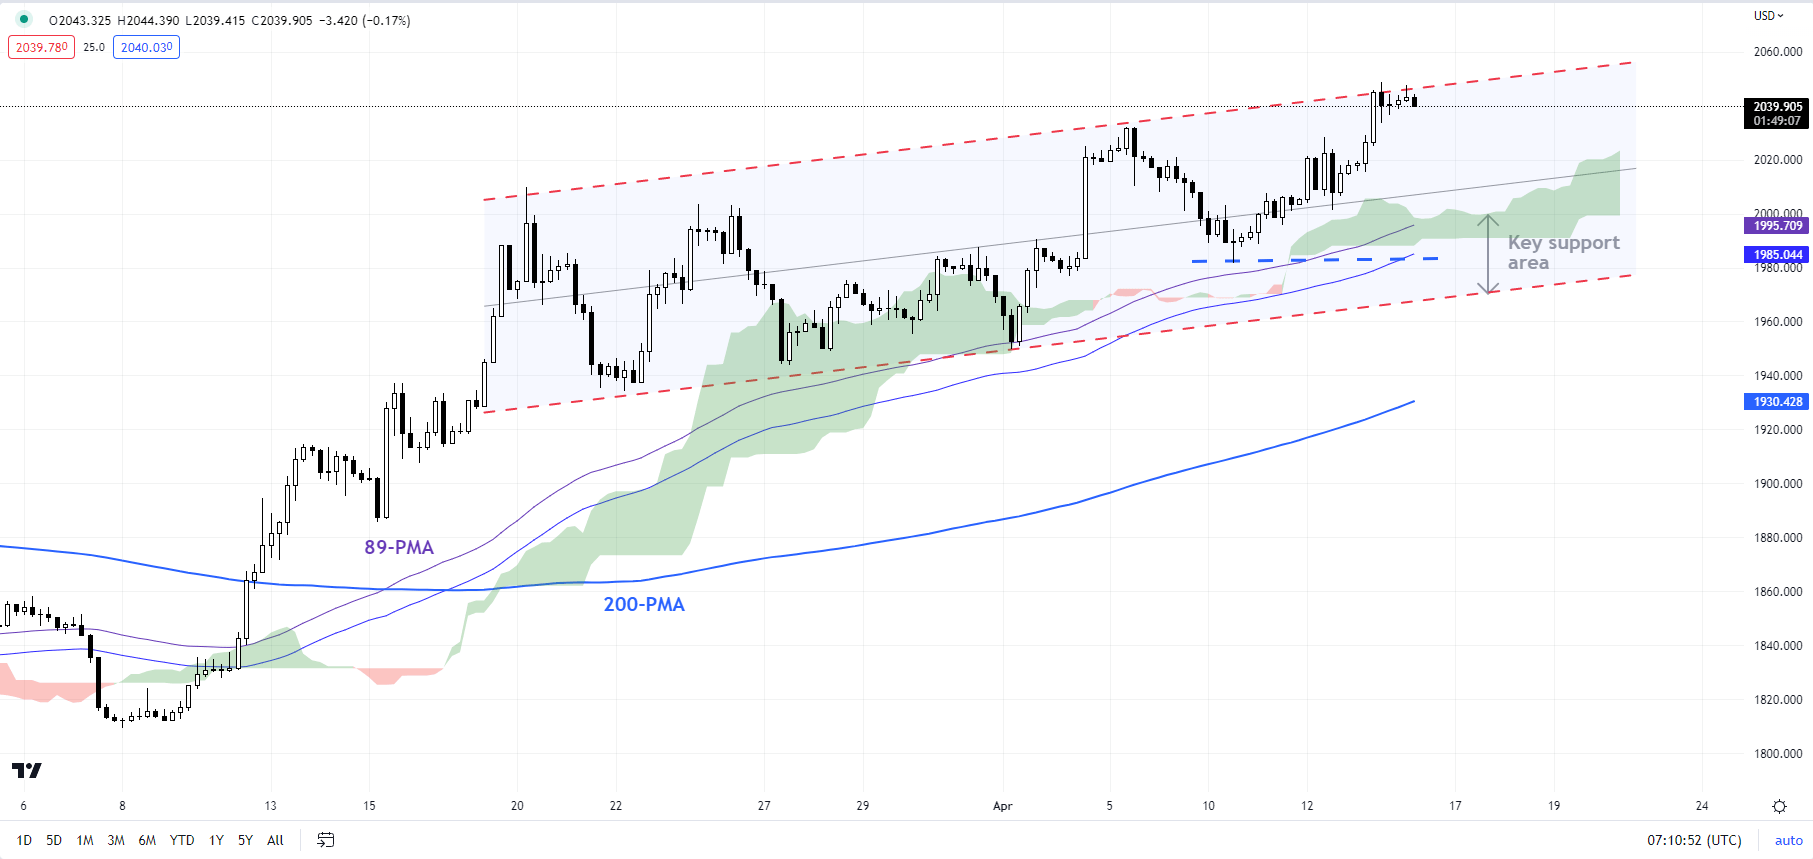
Chart Created Using TradingView
Still, the trend on the daily charts continues to be up, raising the prospect of a test of the 2069-2072 barrier (see colour-coded candlestick charts based on trend/momentum indicators). On the downside, there is key converged support at 1970-1996, including the 89-period moving average on the 240-minute charts and the April 10 low. For the short-term upward pressure to fade, the yellow metal would need to break below the 1970-1996 area.
XAU/USD Daily Chart
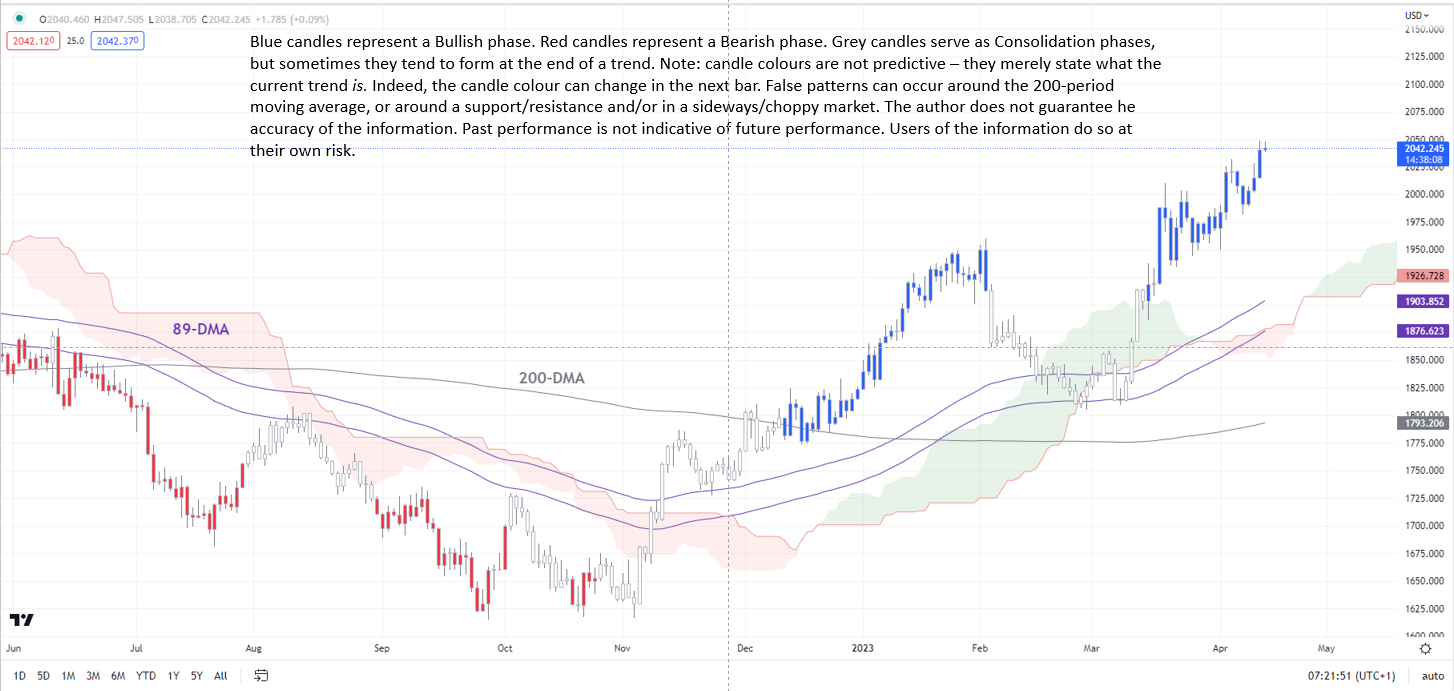
Chart Created by Manish Jaradi Using TradingView
--- Written by Manish Jaradi, Strategist for DailyFX.com
--- Contact and follow Jaradi on Twitter: @JaradiManish


