
Most Read: British Pound Sentiment Analysis & Outlook: GBP/USD, EUR/GBP and GBP/JPY
Wondering how retail positioning can shape gold prices? Our sentiment guide provides the answers you are looking for—don't miss out, get the guide now!
| Change in | Longs | Shorts | OI |
| Daily | 0% | -3% | -2% |
| Weekly | -9% | 7% | -1% |
GOLD PRICE TECHNICAL ANALYSIS
Gold (XAU/USD) fell on Wednesday, marking the second consecutive session of losses and nearly erasing Monday's entire rally. Despite short-term ups and downs, the precious metal has been locked in a sideways movement for the past two weeks. This period of consolidation clearly highlights the current market indecision, with traders likely waiting for new catalysts before taking new directional bets.
To break out of this holding pattern, gold will need to clear either the resistance at $2,355 or the support at $2,280. A move above resistance would likely shift focus towards $2,415, potentially rekindling interest in the all-time high. Alternatively, a breach of support could trigger a slump towards an important Fibonacci area at $2,260, with further downside risk towards $2,225 in the event of a breakdown.
GOLD PRICE TECHNICAL CHART
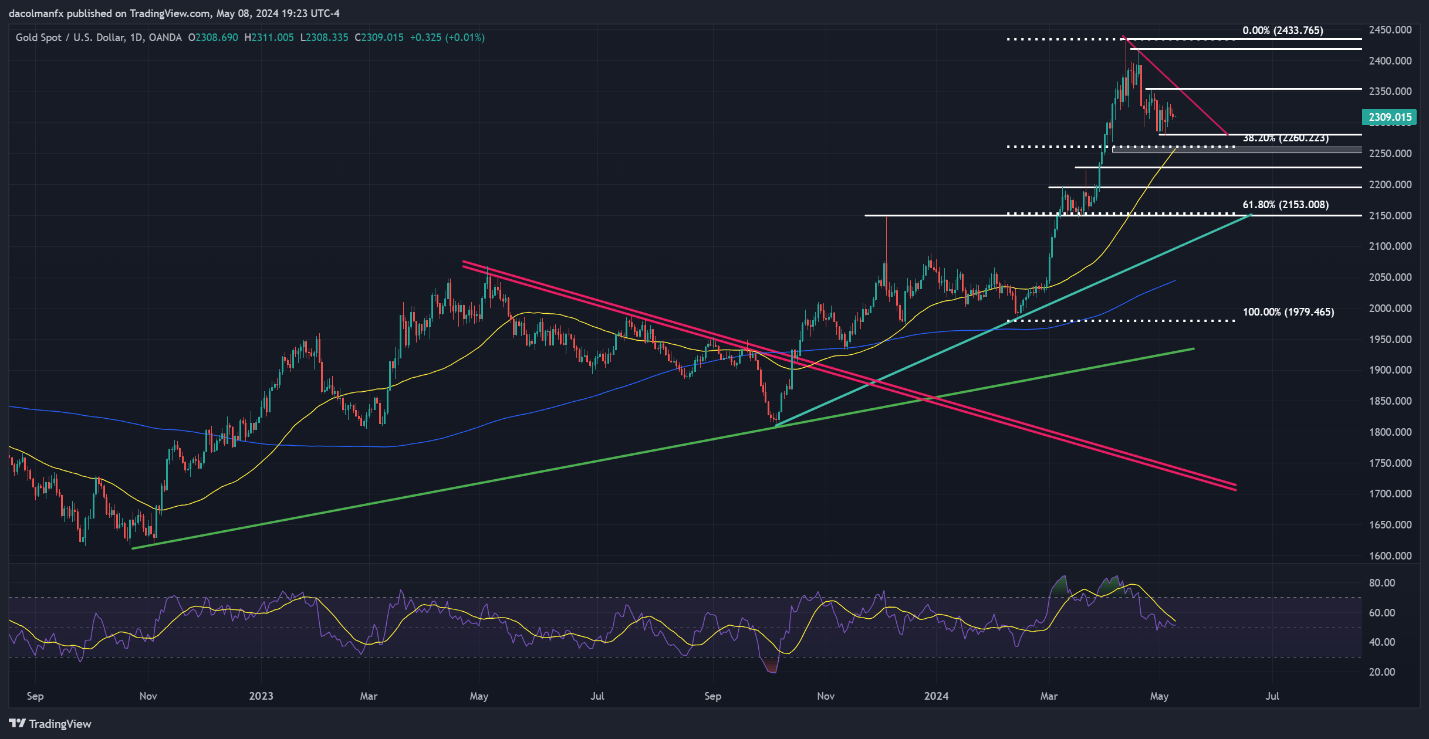
Gold Price Chart Created Using TradingView
Access exclusive insights and strategies for USD/JPY by downloading the Japanese yen trading guide!

USD/JPY TECHNICAL ANALYSIS
USD/JPY gained ground on Wednesday, climbing above resistance at 154.65. Should bullish momentum persist in the days ahead, prices may be able to push towards 158.00. On continued strength, all eyes will be on the 160.00 handle. Traders should approach any movement towards these levels with caution, as Tokyo may intervene to bolster the yen, causing the pair to quickly reverse its direction.
Alternatively, if upside pressure weakens and the exchange rate veers downwards unexpectedly, potential support zones include 154.65, followed by 153.15. Further losses below this juncture may reignite bearish sentiment, creating the right conditions for a descent towards trendline support and the 50-day simple moving average, positioned just above the psychological 152.00 mark.
USD/JPY TECHNICAL CHART
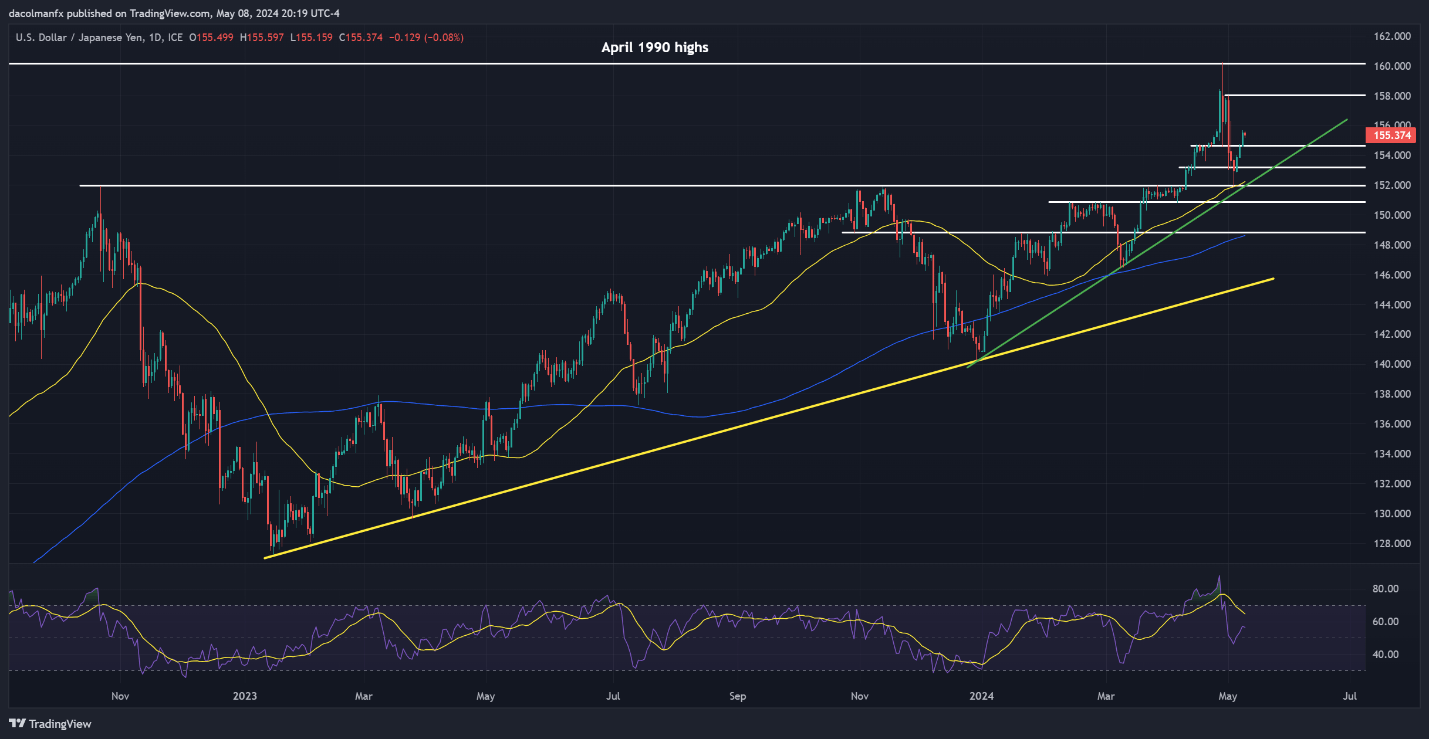
USD/JPY Chart Created Using TradingView
Want to know where the euro may be headed in the second quarter? Explore all the insights available in our quarterly outlook. Request your complimentary guide today!
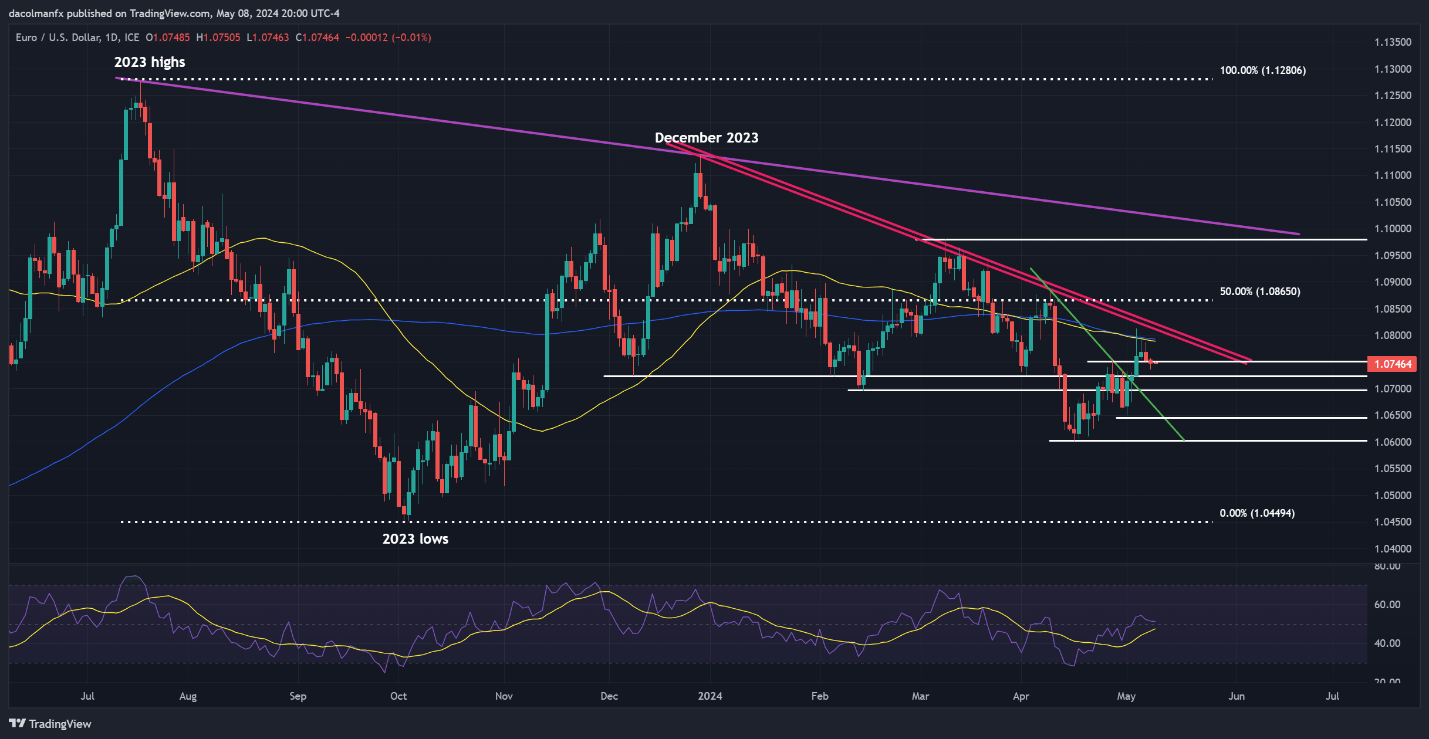
EUR/USD FORECAST - TECHNICAL ANALYSIS
EUR/USD slipped modestly on Wednesday, threatening to take out a key support at 1.0750. Should prices breach this threshold decisively later this week, selling momentum could pick up traction, potentially leading to a pullback towards 1.0725 and even 1.0695. Subsequent weakness could prompt a retreat towards the May lows in the vicinity of 1.0650.
In the scenario of a bullish turnaround, the first obstacle to monitor lies near 1.0790, succeeded by 1.0820 – a technical zone that aligns with a medium-term downtrend line originating from the December 2023 highs. Additional gains beyond this point could open the door to a rally towards 1.0865, the 50% Fibonacci of the 2023 leg lower.
EUR/USD PRICE ACTION CHART