For an extensive analysis of gold’s fundamental and technical outlook, download our complimentary quarterly trading forecast now!

GOLD PRICE TECHNICAL ANALYSIS
Gold (XAU/USD) took a step back on Tuesday following Monday’s solid performance, slipping by around 0.4% to settle near $2,315. Despite recent fluctuations to the upside and downside, the precious metal has not really gone anywhere in the past two weeks, with volatility shrinking over the period in question in a possible sign of consolidation and traders waiting for new catalysts before reengaging.
The market consolidation is not likely to end until prices either push past resistance at $2,355 or breach support at $2,280. Should resistance be overcome, the focus will turn to $2,415. Additional gains from this point forward may lead to renewed interest in the all-time high. Meanwhile, a break of support could trigger a fall towards a key Fibonacci floor at $2,260. Below this area, the spotlight will be on $2,225.
GOLD PRICE TECHNICAL CHART
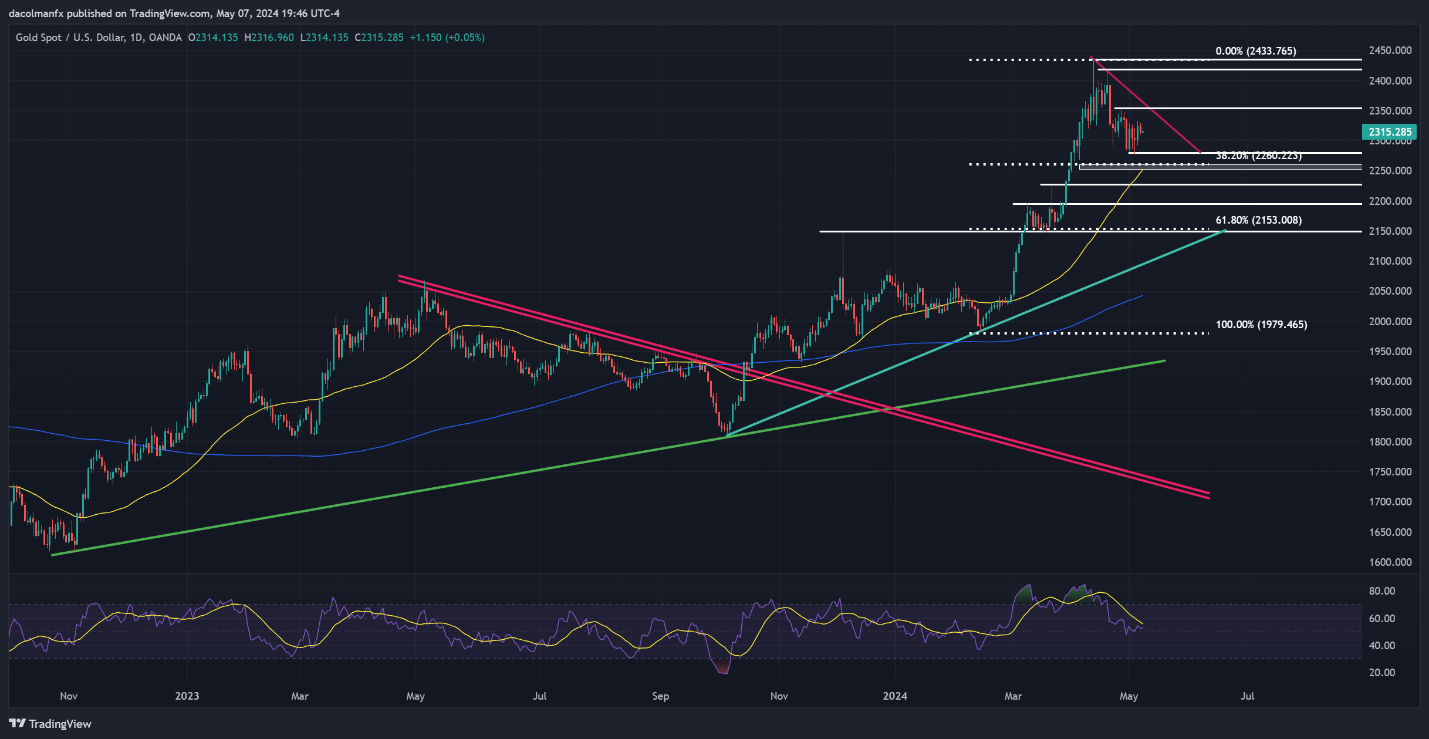
Gold Price Chart Created Using TradingView
Stay ahead of the curve and improve your trading prowess! Download the EUR/USD forecast for a thorough overview of the pair’s technical and fundamental outlook.

EUR/USD FORECAST - TECHNICAL ANALYSIS
EUR/USD dipped slightly on Tuesday after a third failed attempt to break above its 50-day and 200-day simple moving averages at 1.0790, an area of strong resistance. Prices subsequently edged towards support at 1.0750. Maintaining this technical floor is essential to prevent a deeper retracement; failure to do so might lead to a move towards 1.0725 and possibly even 1.0695.
In the event of a bullish turnaround, the first ceiling to keep an eye on looms near 1.0790, followed by 1.0820, which corresponds to a medium-term downtrend line extended from the December 2023 highs. On further strength, bulls may feel emboldened to initiate an attack on the 50% Fibonacci retracement of the 2023 slump, located around 1.0865.
EUR/USD PRICE ACTION CHART
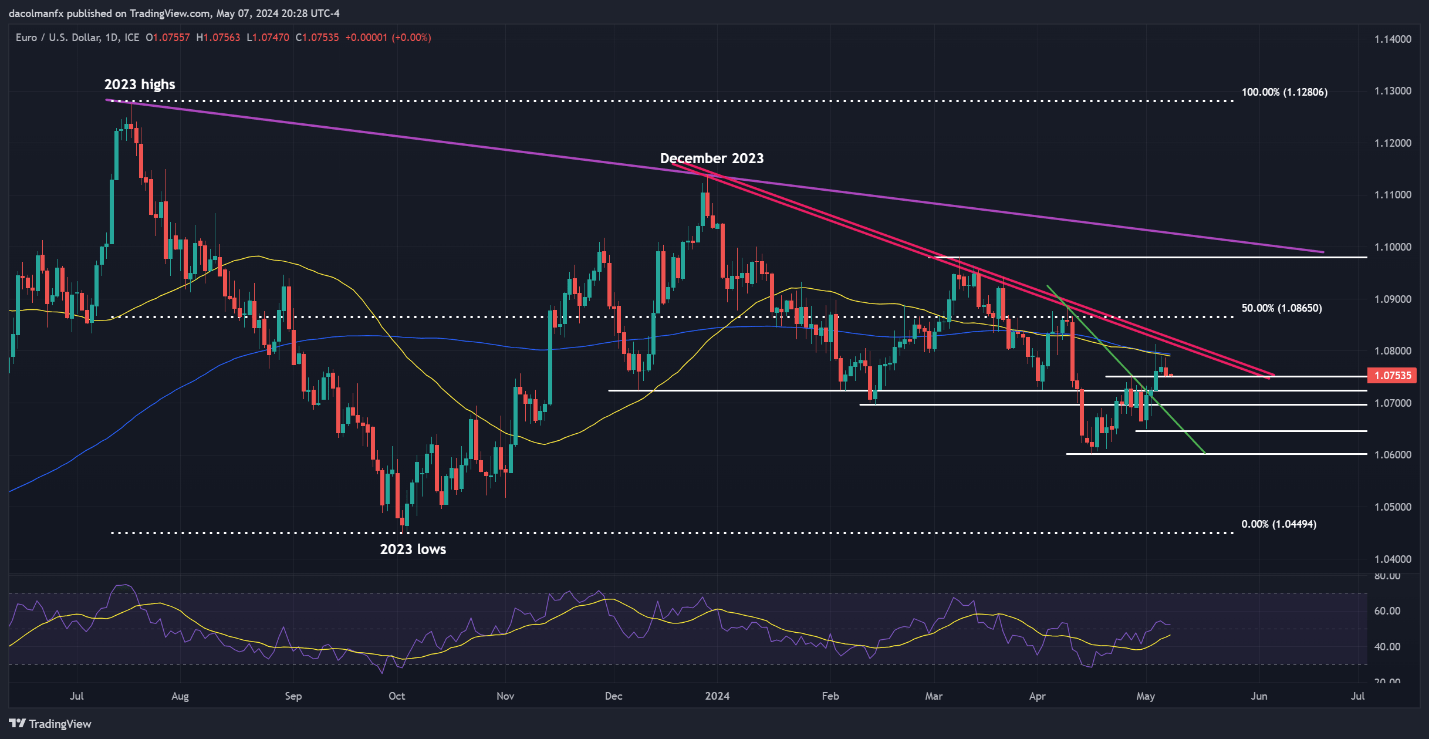
EUR/USD Chart Created Using TradingView
Curious about GBP/USD’s path ahead? Dive into our second-quarter outlook for expert analysis and strategies. Don't hesitate—request your free guide today and gain an edge in your trading!

GBP/USD FORECAST - TECHNICAL ANALYSIS
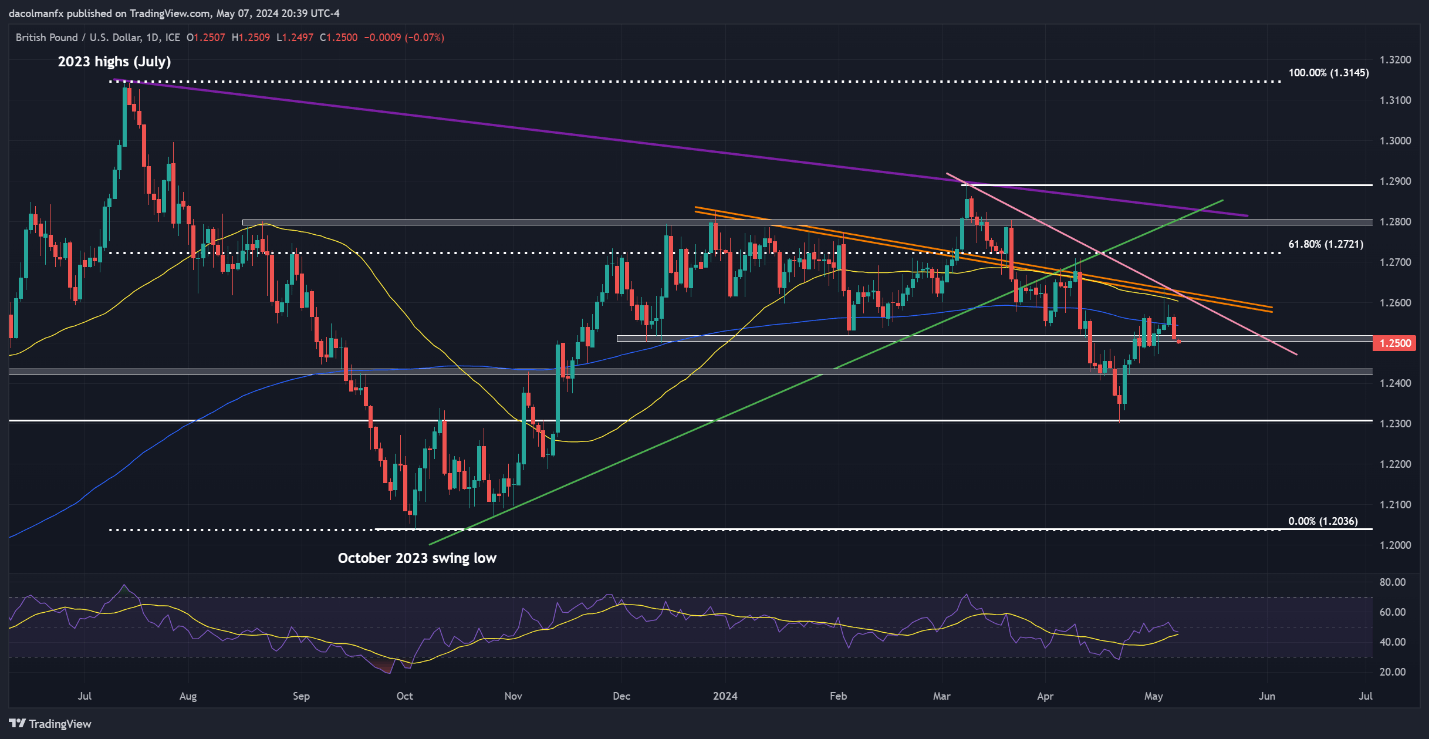
GBP/USD also fell on Tuesday, nearly breaching the 1.2500 handle. A decisive drop below this threshold in the upcoming days could amplify bearish pressure, potentially prompting a retest of technical support near 1.2430. While prices might find stability around these levels during a pullback before a rebound, a breakdown could pave the way for a retrenchment toward the psychological 1.2300 mark.
On the flip side, if buyers stage a comeback and propel cable above its 200-day simple moving average, confluence resistance stretches from 1.2600 to 1.2630, where the 50-day simple moving average intersects with two important trendlines. Upside clearance of this barrier could inject optimism into the market and boost the pound further, creating the right environment for a rally towards 1.2720.
GBP/USD PRICE ACTION CHART