


Gold, XAU/USD – Price Action & Sentiment:
- XAU/USD remains above vital support despite the jump in US Treasury yields.
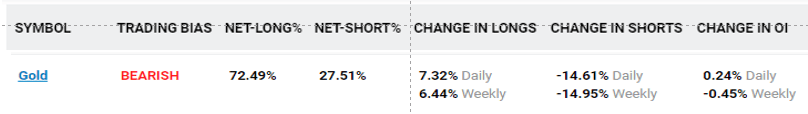
- Retail traders’ long positioning looks stretched.
- What is the outlook and key levels to watch in XAU/USD?

Gold is at a critical juncture - stretched retail traders’ long positioning poses downside risks to XAU/USD. However, if the past is any guide, the yellow metal may not be ripe for a bearish break just yet.
Source: https://www.dailyfx.com/sentiment-report
The IG Client Sentiment (IGCS) shows 72% of retail traders are net-long with the ratio of long to short at 2.6 to 1. The number of traders net-long is 6.4% higher from last week. The IGCS data at times functions as a contrarian indicator – the fact traders are net-long suggests the next move in gold could be down.
XAU/USD Daily Chart
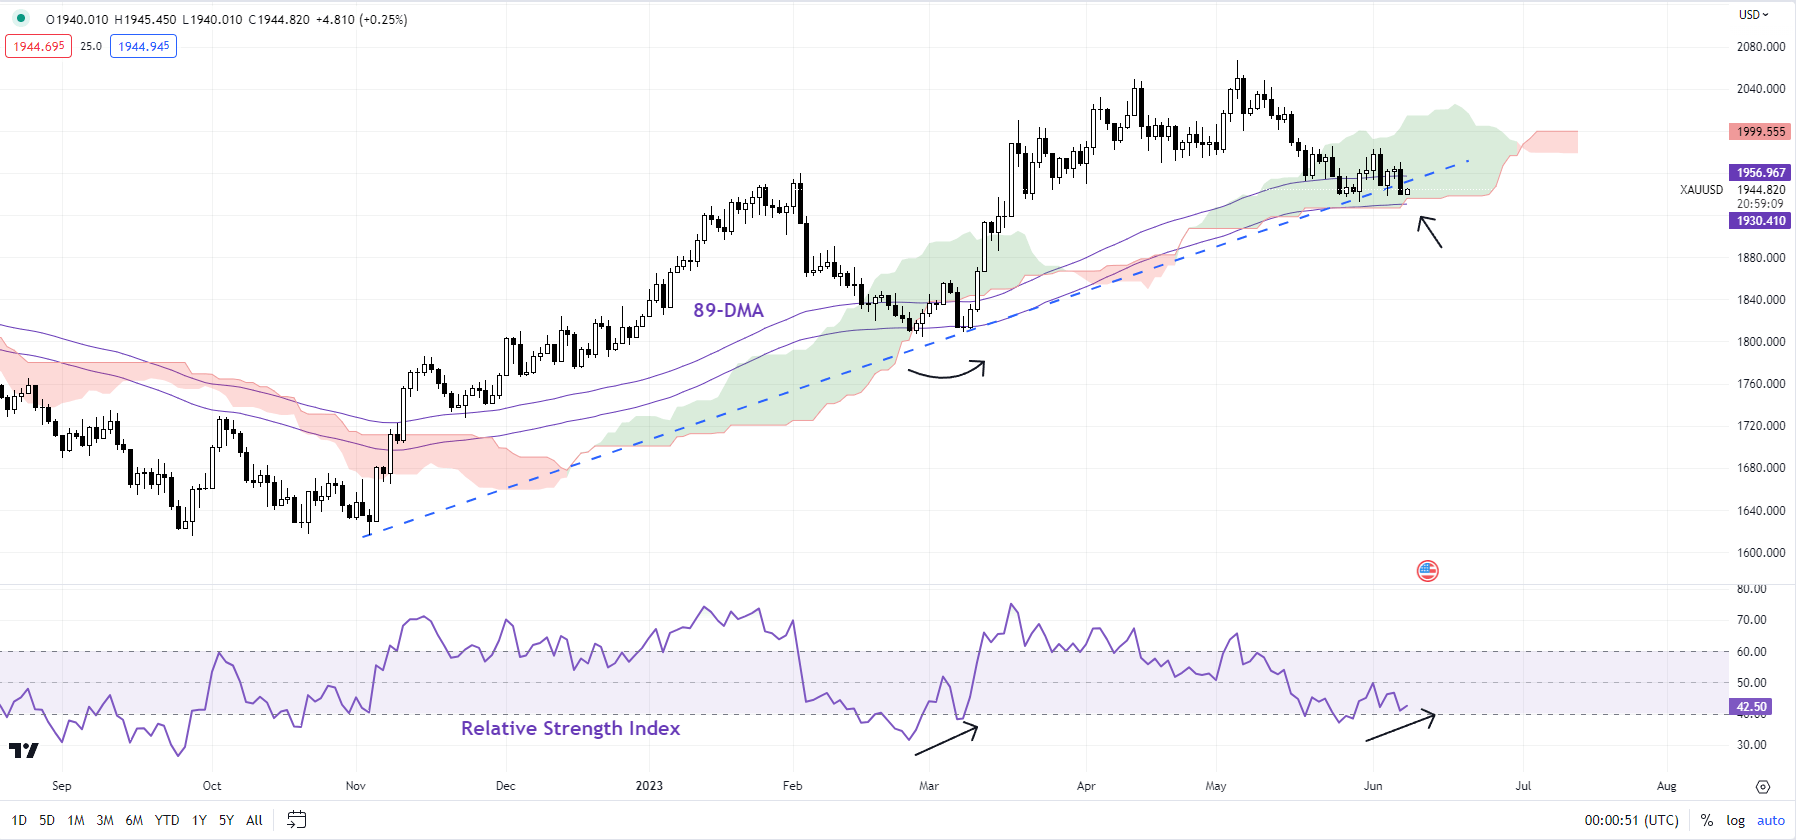
Chart Created by Manish Jaradi Using TradingView
The technical setup remains broadly unchanged from the previous update. See “Retreat in US Yields Supports Gold, But for How Long? XAU/USD, XAU/EUR Price Setups”, published May 31. On the daily chart, gold remains above quite a strong cushion around 1930, including an uptrend line from the end of 2022, the 89-day moving average, and the lower edge of the Ichimoku cloud. The colour-coded candlestick daily charts show the current trend is a consolidation within the overall bullish structure.
XAU/USD 240-minute Chart
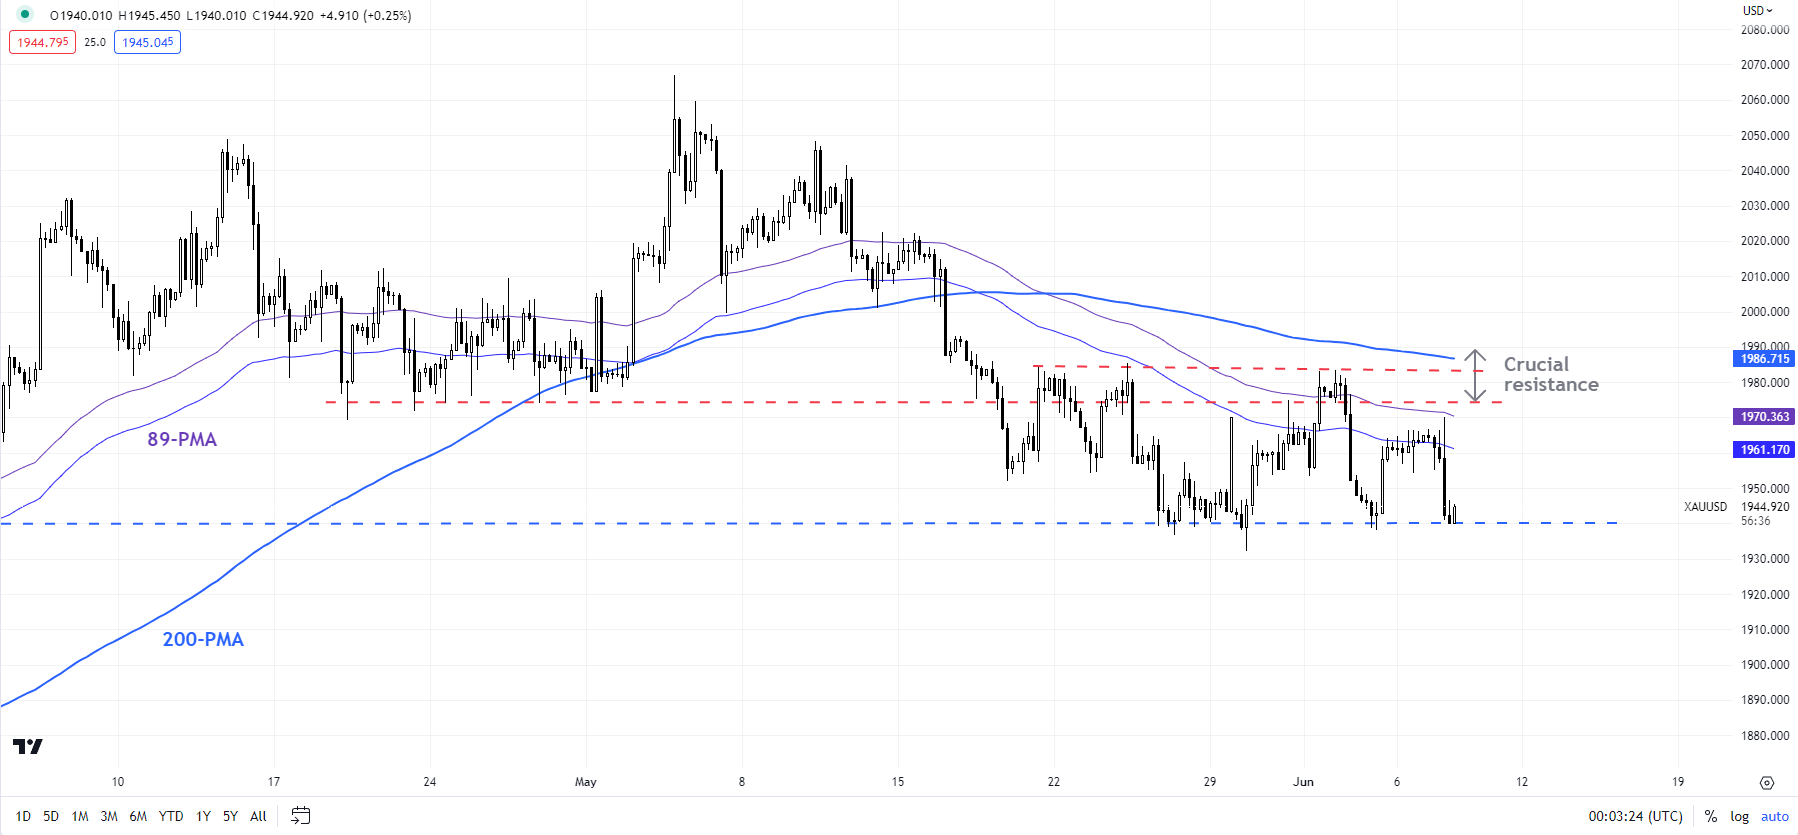
Chart Created by Manish Jaradi Using TradingView
Interestingly, the 14-day Relative Strength Index (RSI) is attempting to form a base – the previous retreat earlier this year terminated with a similar setup (see the daily chart). For a material rebound to occur this time around, XAU/USD would need to clear the immediate ceiling around 1980-1987 (including the 200-period moving average on the 240-minute chart and Friday’s high).
XAU/USD 240-minute Chart
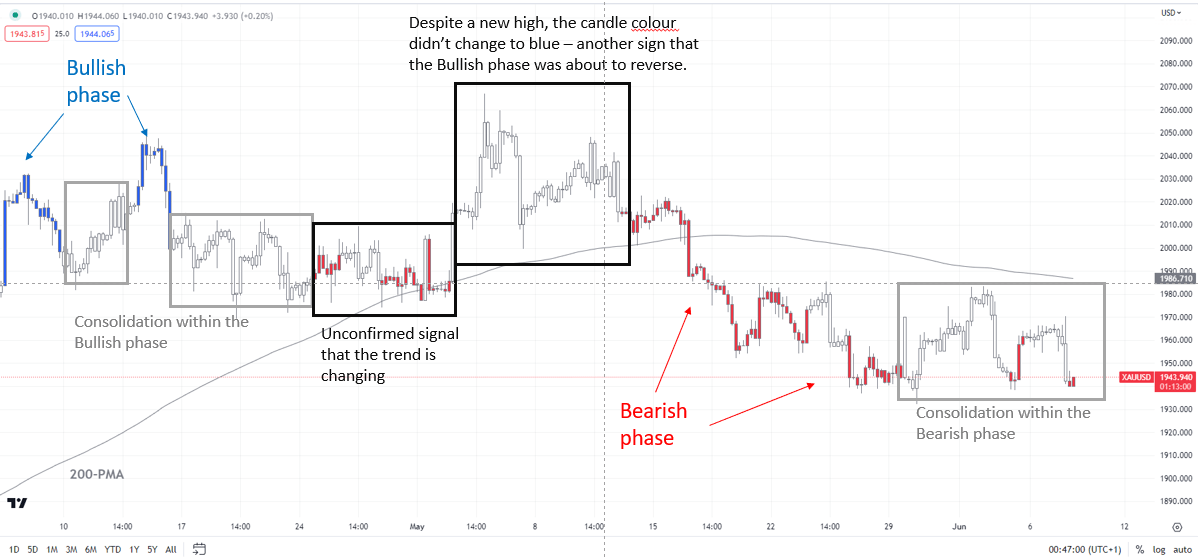
Chart Created by Manish Jaradi Using TradingView; Notes at the bottom of the page.
Until then, the bearish setup on smaller and higher timeframes could dominate. The 240-minute colour-coded candlestick charts show XAU/USD remains in a broadly bearish phase. In recent months, the momentum on higher timeframe charts has been a concern - see previous updateson March 28,April 16,April 24,May 10, and “Is This the Moment of Reckoning for Gold?”, published May 17.
XAU/USD Daily Chart
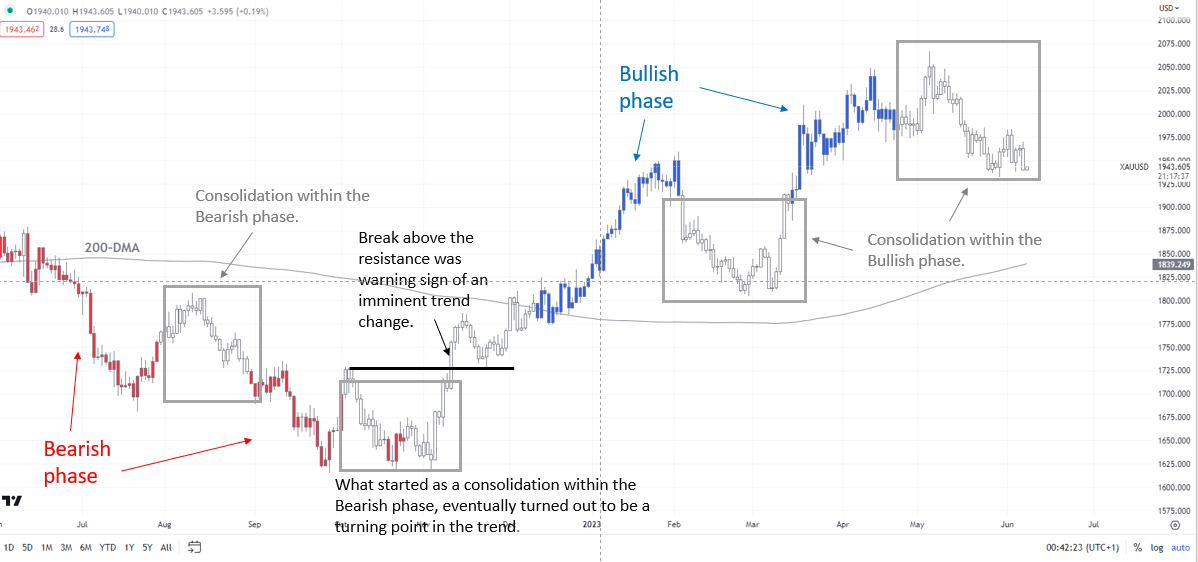
Chart Created by Manish Jaradi Using TradingView; Notes at the bottom of the page.
Any break above 1980-1987 could expose upside scenarios toward 2020 or even 2048. On the downside, a decisive break under 1930 could open the door toward the 200-day moving average (now at about 1840).
XAU/USD Monthly Chart
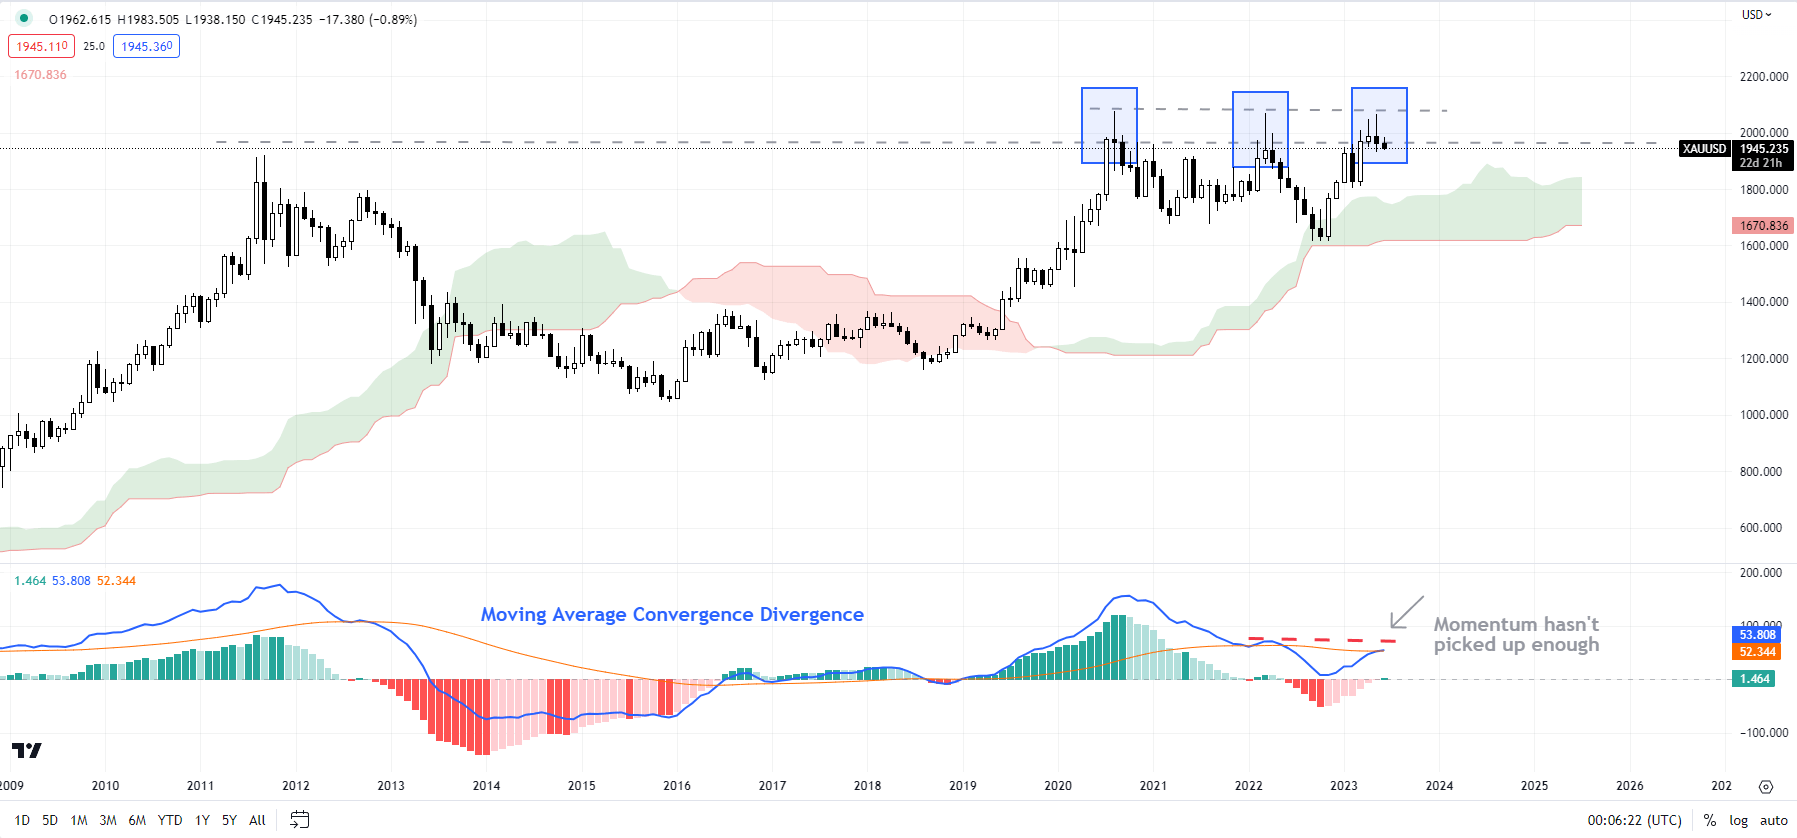
Chart Created by Manish Jaradi Using TradingView
Note: The above colour-coded chart(s) is(are) based on trending/momentum indicators to minimize subjective biases in trend identification. It is an attempt to segregate bullish Vs bearish phases, and consolidation within a trend Vs reversal of a trend. Blue candles represent a Bullish phase. Red candles represent a Bearish phase. Grey candles serve as Consolidation phases (within a Bullish or a Bearish phase), but sometimes they tend to form at the end of a trend. Candle colors are not predictive – they merely state what the current trend is. Indeed, the candle color can change in the next bar. False patterns can occur around the 200-period moving average, or around a support/resistance and/or in sideways/choppy market. The author does not guarantee the accuracy of the information. Past performance is not indicative of future performance. Users of the information do so at their own risk.
--- Written by Manish Jaradi, Strategist for DailyFX.com
--- Contact and follow Jaradi on Twitter: @JaradiManish


