


Elliott wave patterns for silver and gold point to a tired downtrend. USD/JPY continues to rally in motive waves keeping the longer term forecast alive.
The video above is a recording of a US Opening Bell webinar from April 22, 2019. We focused on the Elliott Wave patterns for key markets such as gold, silver, crude oil, DXY, EURUSD, USDJPY, and EURJPY.
Silver prices closing in on pivot zone
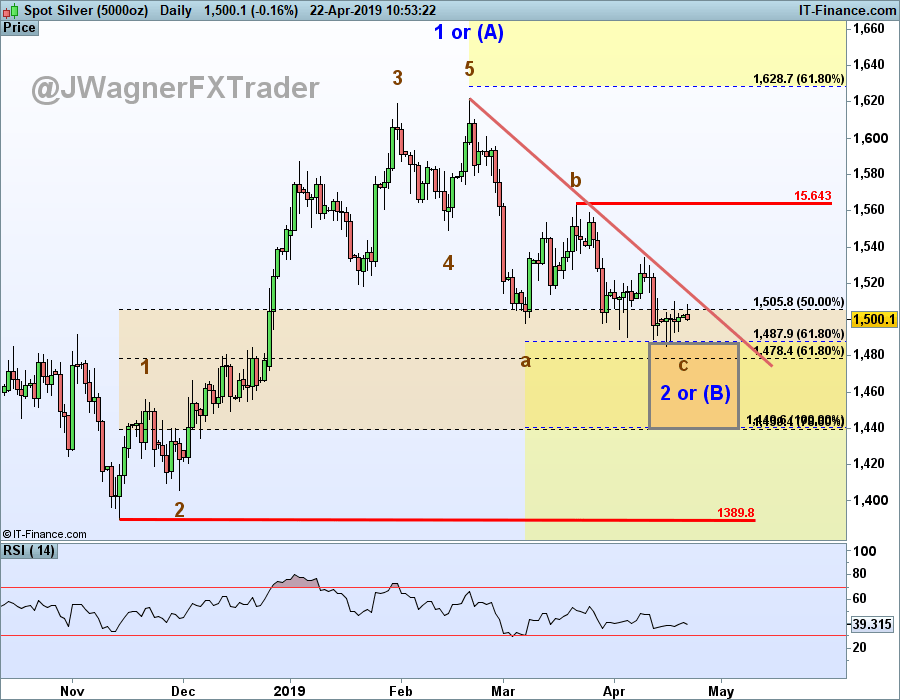
Silver prices have barely nicked our potential reversal zone of 14.40-14.80. Little progress has been made since April 15 and the waves do not appear motive. Therefore, we will not be surprised if silver makes a deeper cut and one more jab towards lower prices.
The intraday chart shows RSI divergence when comparing the March 28, April 11, and April 15 lows. This is symptomatic of slowing momentum and potential reversal looming nearby.
Once this trend that began on February 20 terminates (which we believe prices are getting close), then we are looking for a multi-month rally to press higher towards $17 and possibly $19.
Therefore, wait for another dip and look for bullish signs to emerge. A move above 15.64 suggests the low may be in and silver prices possibly continue higher towards $17 and possible $19. Additionally, a sustained break above the red downward sloping resistance trend line may be an early warning signal the trend has shifted from down to up.
We believe silver is in the ‘c’ wave of a zigzag pattern. Once this ‘c’ wave exhausts from not much below where silver is trading now, we will anticipate a large rally to $17 and possibly $19 that may take many months to complete.
Read more…
Gold prices dip while lower levels still in sight
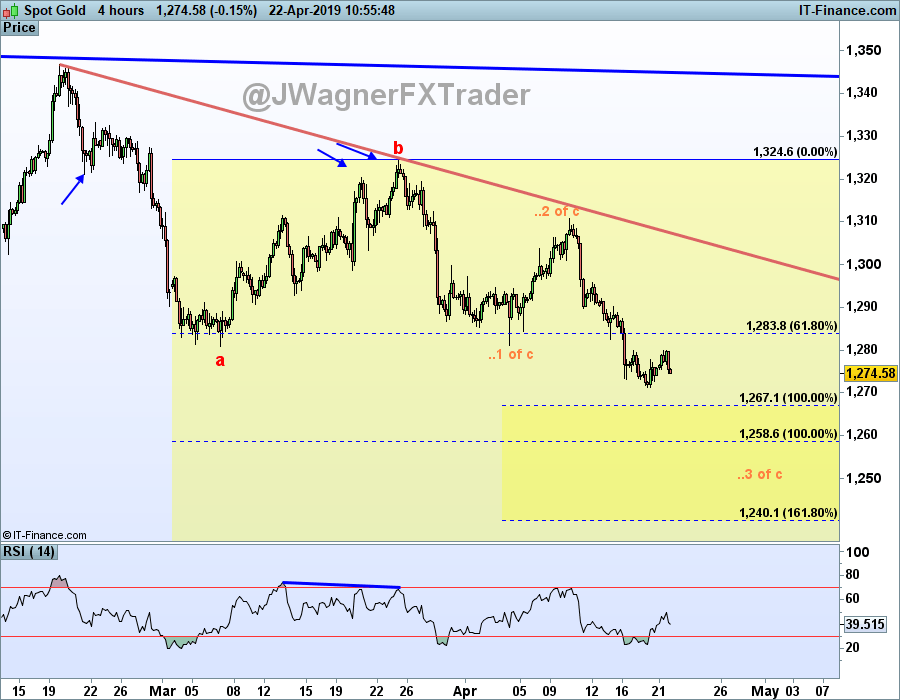
In last week’s webinar, we highlighted how gold may see a sharp mover lower that likely persists below $1250. Well, gold prices did dip to $1270, then paused heading into the holiday weekend. The higher probability gold forecast is for gold to continue lower below $1250.
Therefore, we are showing the current Elliott wave for gold to be wave 3 of ‘c’ (zigzag) of wave E of a triangle (X). The triangle that began in July 2016 is within the final wave. If correct, gold’s corrective dip from February 2019 would lead to a large rally during the last part of 2019.
Though not expected, if gold prices do run higher above $1325 before dropping below $1250, then we will need to reassess the forecast and reconsider if the multi-year Elliott wave triangle that began July 2016 may have finished and found a low.
Read more…
Top gold trading strategies and tips
Gold to silver ratio suggests silver prices may outperform gold prices
When viewing these trends within the context of the gold to silver ratio, we are anticipating silver to outperform gold. The current gold to silver ratio sits near multi-decade extremes and that suggests a downturn in the ratio. If the trends for gold and silver individually are about to shift towards higher levels, then silver would need to outperform gold to drag the gold to silver ratio lower.
Read more…
Trading the gold-silver ratio: strategies and tips
USD/JPY Rallies in motive waves and dips in corrective waves
From the January 2, 2019 low, USD/JPY has been rallying in motive waves and dipping lower in corrective waves. This keeps our longer-term bullish USD/JPY forecast in play.
That is to say, the longer-term outlook for USD/JPY remains bullish to new highs that may press towards 135 and possibly 150 over the next couple years.

Elliott Wave Theory FAQ
How does Elliott Wave theory work?
Elliott Wave theory is a trading study that identifies the highs and lows of price movements on charts via wave patterns. Traders analyze the waves for 5-wave moves and 3-wave corrections to determine where the market is at within the larger pattern. Additionally, the theory maintains three rules and several guidelines on the depth of the waves related to one another. Therefore, it is common to use Fibonacci with Elliott Wave analysis. We cover these topics in our beginners and advanced Elliott Wave trading guides.
After reviewing the guides above, be sure to follow future Elliott Wave articles to see Elliott Wave Theory in action.
---Written by Jeremy Wagner, CEWA-M
Jeremy Wagner is a Certified Elliott Wave Analyst with a Master’s designation. Jeremy provides Elliott Wave analysis on key markets as well as Elliott Wave educational resources. Read more of Jeremy’s Elliott Wave reports via his bio page.
Join Jeremy in his live US Opening Bell webinar where these markets and more are discussed through Elliott wave theory.
Follow Jeremy on Twitter at @JWagnerFXTrader .
Recent Elliott Wave analysis you might be interested in…
S&P 500 Patterns Point to an Eventual December Low Retest


