


Patterns for commodities such as silver, gold and crude oil point to a temporary dip before embarking upon another uptrend.
The video above is a recording of a US Opening Bell webinar from April 15, 2019. We focused on the Elliott Wave patterns for key markets such as gold, silver, crude oil, USDJPY, DXY, EURUSD, and EURJPY.
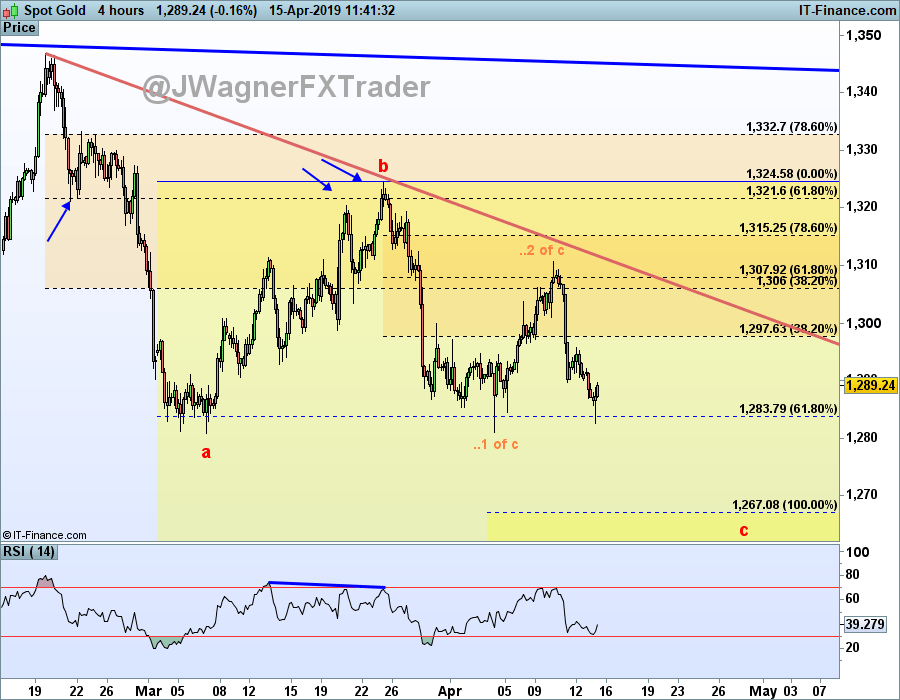
Gold prices may test lower levels
In last week’s webinar, we highlighted how gold and silver prices were searching for a bottom.
So far, the gold price forecast has held up in that the high last week was wave ..2 of c. If correct, then wave ..3 of c would be a sharp move lower that likely persists below $1250. If gold prices struggle to persist lower, then it may indicate a sideways Elliott wave triangle for the ‘b’ wave that is still ongoing. Either way, the gold price outlook is for lower prices so long as gold holds below $1324.
Though not expected, if gold prices do run higher above $1325 before dropping below $1250, then we will need to reassess the forecast and reconsider if the multi-year Elliott wave triangle that began July 2016 may have finished and found a low.
Therefore, we are showing the current Elliott wave for gold to be wave 3 of ‘c’ (zigzag) of wave E of a triangle. We are counting the triangle as a larger wave (X) which began in July 2016.
Read more…
Top gold trading strategies and tips
Silver prices grasping for a bottom
In our webinar today, we spoke how an argument can be made that silver prices are in their last dip into the 14.40-14.80 reversal zone. Divergence is showing up on RSI suggesting a near term turn higher may be on the horizon, if at least a temporary one.
The key level for the bearish view is the 15.64 high. A move above 15.64 suggests the low may be in and silver prices may continue higher towards $17 and possible $19.
We believe silver is in the ‘c’ wave of a zigzag pattern. Once this ‘c’ wave exhausts from not much below where silver is trading now, we will anticipate a large rally to $17 and possibly $19 that may take many months to complete.
Read more…
Trading the gold-silver ratio: strategies and tips

Crude oil forecasts suggest unfinished business to the upside
Crude oil prices have been rallying in an apparent Elliott wave zigzag pattern. The pattern appears incomplete and after a dip to near $61, another rally may ensue to new highs above $65. The current Elliott wave for crude oil suggests we are temporarily correcting lower in wave iv of (c) zigzag. This implies an eventual wave v of (c) higher.
This forecast would hold so long as crude oil prices remain above $57.86.
Read more…
WTI vs Brent: Top 5 Differences
8 Surprising Crude Oil Facts Every Trader Should Know

Elliott Wave Theory FAQ
How does Elliott Wave theory work?
Elliott Wave theory is a trading study that identifies the highs and lows of price movements on charts via wave patterns. Traders analyze the waves for 5-wave moves and 3-wave corrections to determine where the market is at within the larger pattern. Additionally, the theory maintains three rules and several guidelines on the depth of the waves related to one another. Therefore, it is common to use Fibonacci with Elliott Wave analysis. We cover these topics in our beginners and advanced Elliott Wave trading guides.
After reviewing the guides above, be sure to follow future Elliott Wave articles to see Elliott Wave Theory in action.
Not sure if Elliott wave is right for you? Believe it or not, when I first started trading I couldn’t understand why technical analysis worked. Now, I’m 100% technical through Elliott wave. Learn more about how Jeremy got started into Elliott wave from his podcast interview on Trading Global Markets Decoded with Tyler Yell.
---Written by Jeremy Wagner, CEWA-M
Jeremy Wagner is a Certified Elliott Wave Analyst with a Master’s designation. Jeremy provides Elliott Wave analysis on key markets as well as Elliott Wave educational resources. Read more of Jeremy’s Elliott Wave reports via his bio page.
Join Jeremy in his live US Opening Bell webinar where these markets and more are discussed through Elliott wave theory.
Follow Jeremy on Twitter at @JWagnerFXTrader .
Recent Elliott Wave analysis you might be interested in…
S&P 500 Patterns Point to an Eventual December Low Retest


