


Forex Talking Points:
- If you’re looking to improve your trading approach, our Traits of Successful Traders research could help. This is based on research derived from actual results from real traders, and this is available to any trader completely free-of-charge.
- If you’re looking for a primer on the FX market, we can help. To get a ground-up explanation behind the Forex market, please click here to access our New to FX Trading Guide.
If you’d like to sign up for our webinars, we host an event on Tuesday and Thursday, each of which can be accessed from the below links:
Tuesday: Tuesday, 1PM ET
Thursday: Thursday 1PM ET
US Dollar Bounce From Trend-Line Support Keeps Ascending Triangle in Play
It’s been a busy start to 2019 but, for all intents and purposes, the US Dollar hasn’t done much by way of excitement. The currency has spent the duration of the period building deeper into an ascending triangle formation, the expanse of which was on full display in the month of March.
Prices bulled higher earlier in the month on the back of the European Central Bank’s announcement to trigger a fresh round of TLTRO’s. Prices jumped up for a re-test of the yearly highs around 97.70, at which point the music stopped and bears started to push. That theme lasted for almost two full weeks, until last Wednesday when prices tested the support side of the formation, taken from a bullish trend-line that connects September and January swing-lows.
Ascending triangle formations will often be approached in a bullish manner, looking for the motivation that’s driven buyers-in at higher-lows to, eventually, take-over to allow for a break of the horizontal resistance that’s continued to temper the highs.
US Dollar Daily Price Chart

On a shorter-term basis, however, the field is considerably more open as there is a lack of near-term trend. This can keep the door open for swing-strategies on either side of the Greenback.
Current support is coming in from 96.47, which is a familiar level as drawn from the 23.6% Fibonacci retracement of the 2011-2017 major move. Above current price action, resistance potential exists around the 97.00-area, followed by 97.21-97.30 (the February swing high) and then 97.70 (the yearly high, top of ascending triangle formation). Underneath price action, support potential remains at 96.30 and 96.03, and then from last week’s swing-lows around 95.74-95.82. A downside break through that zone can open the door for deeper bearish trends.
US Dollar Two-Hour Price Chart

EURUSD Meanders in Range, Brings Breakdown Potential
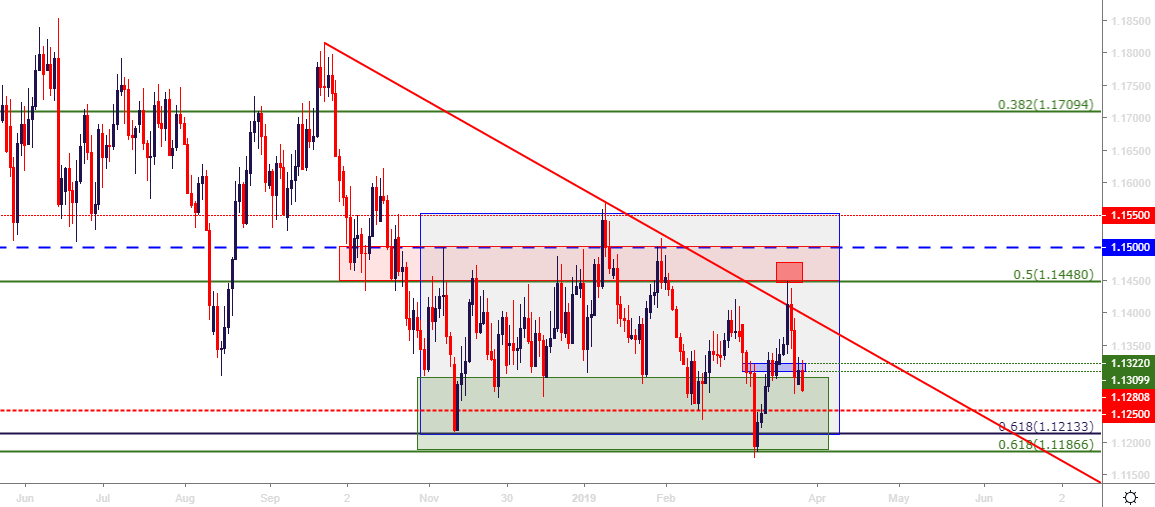
Going along with the above scenario in the US Dollar, EURUSD has spent most of 2019 so far in a range. And this is the same range that was in-play in November and December, making for a remarkably dull five-month outing in the world’s most popular currency pair.
On a longer-term basis, the range remains, and it would be difficult to argue against that. Shorter-term, however, there may be a bearish case to be made after the ECB triggered another round of stimulus in March. Prices were rebuffed at range resistance last week, and sellers have largely remained in-control since, driving prices back into the longer-term support zone.
EURUSD Daily Price Chart
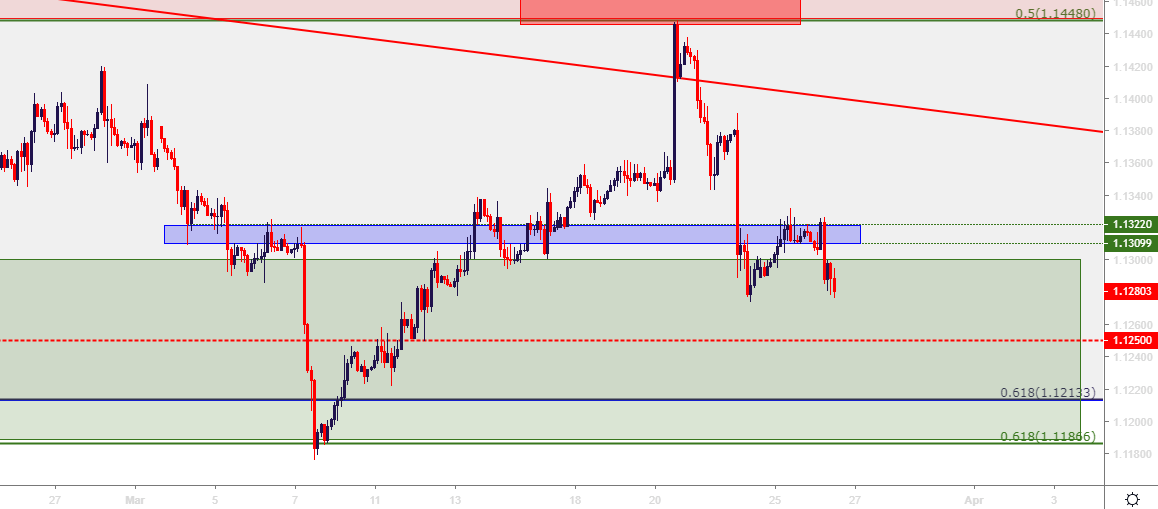
Short-term, there are some bearish qualities here as yesterday’s resistance came-in at a prior area of support. If USD-strength shows into quarter-end, the bottom side of this range may face further tests and, perhaps even a downside break.
EURUSD Two-Hour Price Chart
USDCHF Support Catches at Key Fib: Eyes on Resistance Potential
Last week’s low came in at the .9902 Fibonacci level and, thus far, that’s helped to hold support. The follow-thru bullish response has been lackluster, however, making it difficult for staging reversal campaigns. Atop price action, resistance potential remains around .9982-1.000; and then the longer-term zone from 1.0071-1.0096. Underneath current prices, .9850 is the next support area of interest, followed by .9750-.9766.
USDJPY Resistance Potential at Prior Support
After a significant surge of Yen-strength to begin the year, USDJPY spent most of Q1 with some form of strength. Until last week, that is, around the FOMC rate decision on Wednesday. Selling took over on Thursday and Friday, and as discussed this morning, a showdown is set for a prior area of support-turned-resistance around 110.75-110.86. A hold of resistance here keeps the door open for short-side strategies, re-targeting the 109.67-110.00 zone.
USDJPY Four-Hour Price Chart

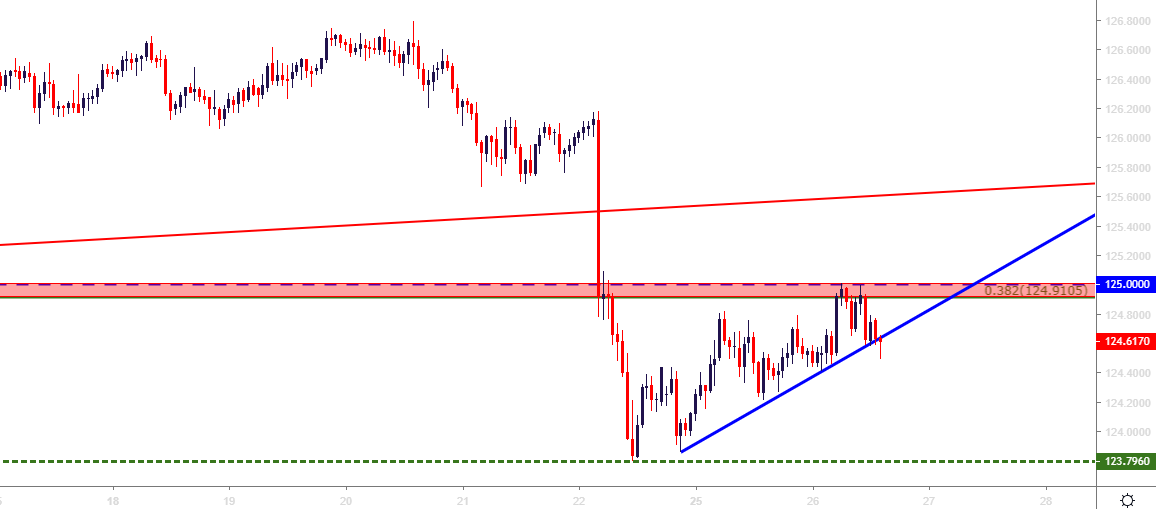
EURJPY for Risk Aversion Scenarios: Testing 125.00
I looked at the short-side of EURJPY for risk aversion themes in this week’s FX Setups of the Week. As discussed in that piece, prices found support at the late-January swing-low around 123.80. I had zeroed in on a resistance zone that runs from 124.91-125.00 which, thus far, has helped to hold the highs. A continued hold here keeps the door open for short-side strategies in the pair.
EURJPY Hourly Price Chart
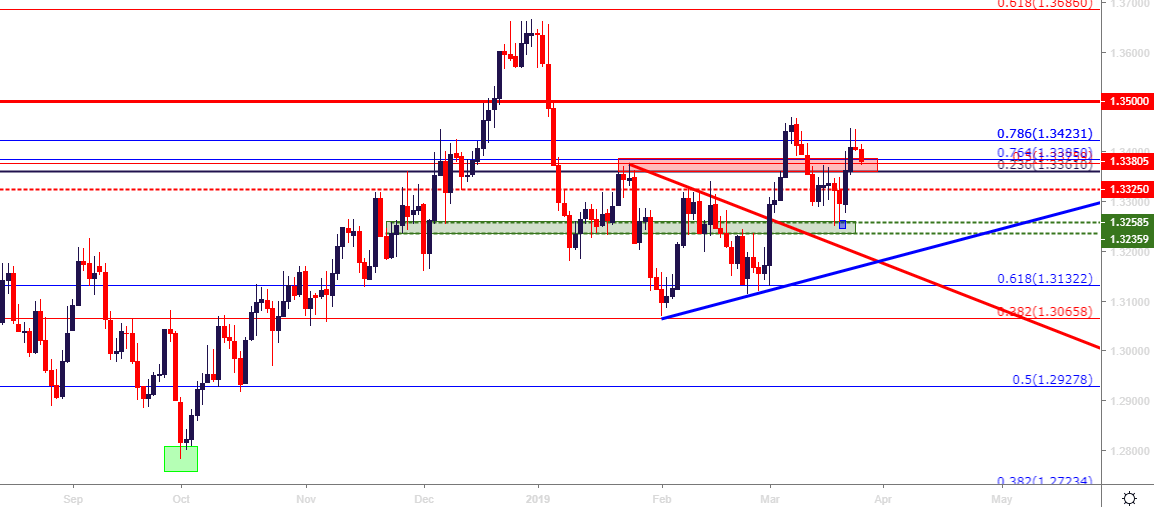
USDCAD Swing Potential
On the short-side of USD, I had looked at USDCAD coming into this week, plotting for a hold of resistance inside of the March high to allow for short-side swing-setups. That has thus far held, keeping the door open for as such. On the Daily chart, price action appears to be working on an evening star pattern, which will generally be approached in a bearish manner. The daily bar isn’t yet closed, so it’s not a confirmed formation as of yet; but a hold of this week’s high inside of last weeks and inside of the earlier-March swing high keeps the door open for short-side strategies in the pair.
USDCAD Daily Price Chart
NZDUSD Grinds Symmetrical Wedge Resistance Ahead of RBNZ
Later tonight brings an RBNZ rate decision. They’ll likely stick with the tone of ‘the next rate move could be up or down,’ leaving market participants with a lack of tone from the bank. Nonetheless, NZDUSD remains near resistance around an area that’s held the highs in the pair for the past nine months. As discussed in this week’s FX Setups, that keeps the short-side of the pair as attractive, particularly for USD-strength strategies.
NZDUSD Daily Price Chart
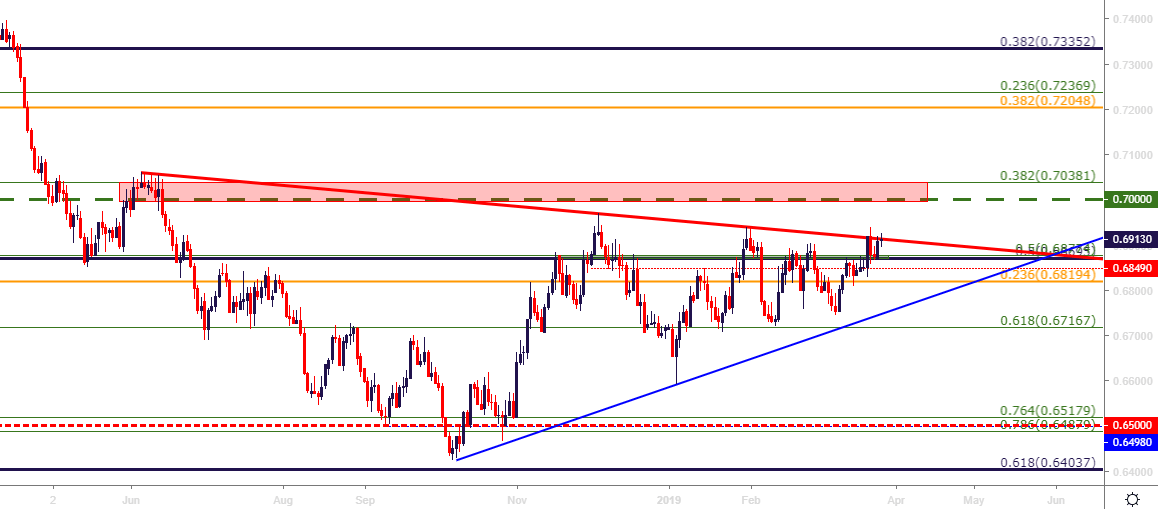
Chart prepared by James Stanley
To read more:
Are you looking for longer-term analysis on the U.S. Dollar? Our DailyFX Forecasts for Q4 have a section for each major currency, and we also offer a plethora of resources on USD-pairs such as EUR/USD, GBP/USD, USD/JPY, AUD/USD. Traders can also stay up with near-term positioning via our IG Client Sentiment Indicator.
Forex Trading Resources
DailyFX offers an abundance of tools, indicators and resources to help traders. For those looking for trading ideas, our IG Client Sentiment shows the positioning of retail traders with actual live trades and positions. Our trading guides bring our DailyFX Quarterly Forecasts and our Top Trading Opportunities; and our real-time news feed has intra-day interactions from the DailyFX team. And if you’re looking for real-time analysis, our DailyFX Webinars offer numerous sessions each week in which you can see how and why we’re looking at what we’re looking at.
If you’re looking for educational information, our New to FX guide is there to help new(er) traders while our Traits of Successful Traders research is built to help sharpen the skill set by focusing on risk and trade management.
--- Written by James Stanley, Strategist for DailyFX.com
Contact and follow James on Twitter: @JStanleyFX


