


FX Setups for the Week of March 11: USDJPY, EURJPY, AUDUSD and USDCNH
Forex Talking Points:
- DailyFX Quarterly Forecasts are available directly from the following link: DailyFX Trading Guides, Q1 Forecasts.
- For trading ideas, please check out our Trading Guides. And if you’re looking for something more interactive in nature, please check out our DailyFX Live webinars.
- If you’d like more color around any of the setups below, join in our live DailyFX webinars each week, set for Tuesday and Thursday at 1PM Eastern Time. You can sign up for each of those sessions from the below link:
Tuesday: Tuesday, 1PM ET
Thursday: Thursday 1PM ET
Do you want to see how retail traders are currently trading the US Dollar? Check out our IG Client Sentiment Indicator.
The first full week of March has proven to be a notable outing across global markets for a number of reasons: The ECB announced a fresh round of LTRTO’s yesterday morning, helping to kickstart a bearish run in the Euro; and after two months of clean-running bullish trends, US stocks started to pullback for an apparent variety of reasons. The US Dollar also saw some interesting events, as prices broke-out to re-test the 21-month high but, at this point, buyers have been unable to push through.
Next week brings a few items of note, with the Brexit vote in the UK as likely one of the key events on the docket. The Bank of Japan hosts a rate decision on Thursday afternoon (Friday morning in Tokyo), and high-impact US data is set to be released on Monday, Tuesday, Wednesday and Friday. This comes on the heels of a very disappointing NFP report that saw 20k jobs added in the month of February versus the expectation of +180k.
Given the moves that have shown this week, carrying weekend risk could be especially problematic here. As such, the four setups looked at below are designed for next week’s price action, looking to avoid weekend gaps through stops that may eliminate the attractiveness of the setup before it ever has a chance to get started.
US Dollar Runs into Resistance at the 21-Month-High
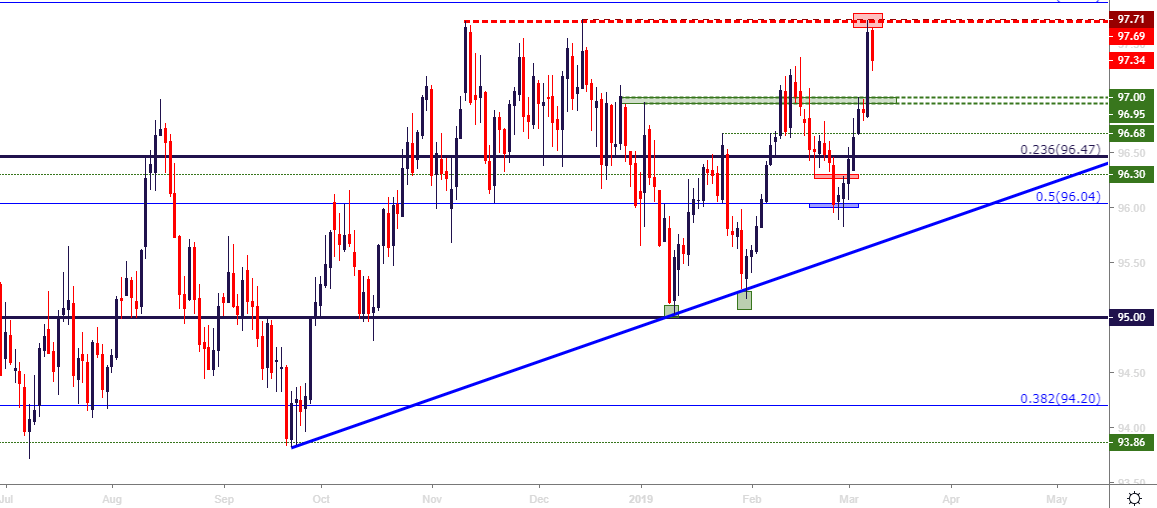
Bullish USDJPY on Hold Above 110.30
USDJPY has done a fairly good job of mirroring the risk trade so far this year, with an incredibly clean topside trend in January and February matching the risk-on themes in US stocks over the same period. But – before that clean running bullish trend could develop, USDJPY started the year with a spark of Yen-strength that had many on the edges of their seats. Risk aversion roared in Q4, and upon the open of the New Year, a surge of strength developed in the Japanese Yen that made it look as though the Q4 risk sell-off might continue into 2019.
Global markets stepped back from the proverbial ledge in January, and this helped USDJPY to recover. As the page turned into February, I began looking for bullish breakouts in the pair as prices interacted with a set of Fibonacci levels at 108.47, 109.67 and 110.86, which are the 38.2, 50 and 61.8% retracements of the November 2017 – March 2018 major move. That bullish trend lasted all the way into this week, at which point sellers reacted to resistance around the 112.00 handle to elicit a pullback all the way back down to the 110.86 Fibonacci level.
That level has since held as support; and if buyers can continue to support the move, this can keep the door open for bullish strategies targeting the 76.4% retracement of the same Fibonacci study at 112.34, which was last showing as swing support in November and December of this year.
USDJPY Eight-Hour Price Chart

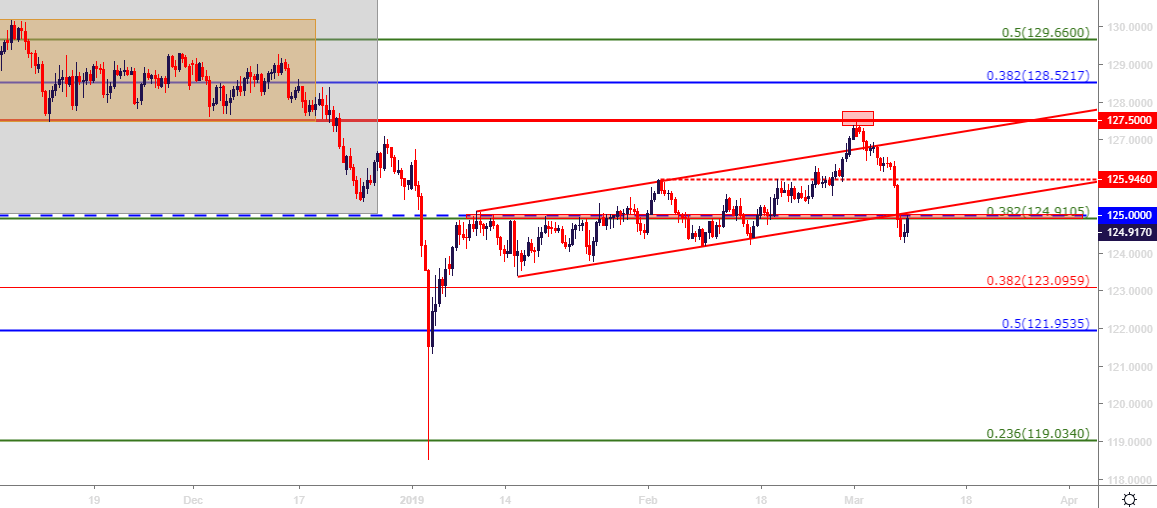
Bearish EURJPY on Hold Below 125.95
On the other side of the Yen, risk aversion themes priced-in very visibly against the Euro this week. The bearish side of EURJPY was my ‘Top Idea for 2019,’ and this market similarly plunged in the opening days of the New Year to test below the 119.00 handle, albeit temporarily. The next two months saw recovery take-hold as the pair built into a bear flag formation; and last Friday saw prices jump up to test resistance at prior support of 127.50.
Since then, however, bears have very much made their mark, and this caught an assist from the ECB announcement earlier this week. Prices in EURJPY plunged below the key level at 125.00, showing a short-side break below the bullish channel that made up the bear flag, and this can open the door for further downside in the pair.
From a strategy basis – this could also offer the trader an opportunity for a synthetic play on the short side of EURUSD. EURUSD may be constrained at long-term support considering the resistance that’s holding in the US Dollar; so, for traders looking at bullish exposure in USDJPY along with bearish exposure in EURJPY, the net outlay would be synthetic EURUSD short, using prevailing forces in the Yen to assist with each side of the pair (risk-on helping with the long side of USDJPY or risk-off helping with the short side of EURJPY).
EURJPY Eight-Hour Price Chart
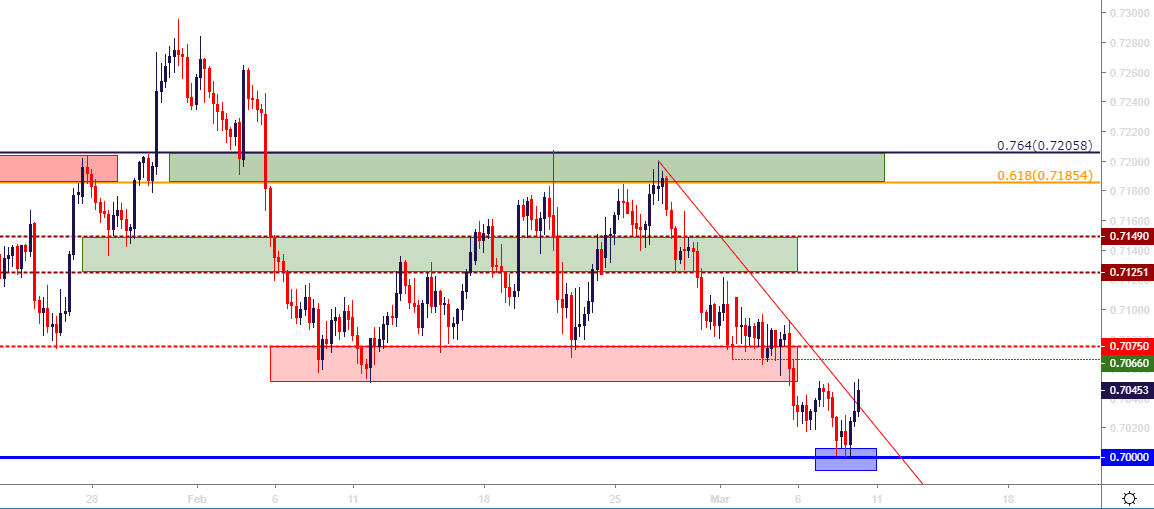
Bullish AUDUSD on Hold Above .7000
AUDUSD tested a big level this week when the .7000-handle came into play, which helped to set the low on Friday morning, just ahead of the USD sell-off on the heels of Non-Farm Payrolls.
On a longer-term basis, the .7000 level is an area that’s been staunchly defended by bulls; with only a handful of occurrences in which prices tested-below, each time with buyers soon pushing spot prices back-above. This can make for an interesting backdrop for USD-weakness strategies, particularly for traders that want to look at a bigger-picture reversal in the US Dollar following this week’s failed resistance test.
In AUDUSD, targets could be sought around prior areas of support/resistance such as .7075, .7125-.7150 and then the big zone that runs from .7185-.7206.
AUDUSD Four-Hour Price Chart
Bearish USDCNH on Hold Below 6.7600
Those that regularly read this piece probably already know that I don’t spend much time trying to call tops or bottoms. But I made an exception in November of last year when looking at USDCNH inching towards the pair’s all-time-high while the US Dollar was incredibly strong (this was around the time the first failed test at 97.71 showed-up in DXY).
Since then, USDCNH has unraveled-lower and that trend has remained fairly-clean so far throughout 2019 trade. The past week has seen a bit of pullback in that trend, and the door may be soon opening to continuation approaches. If prices can stay below the Fibonacci level at 6.7581, the door can remain open for bearish trend strategies. Targeted objectives could be sought at 6.7000, followed by a re-test of the nine-month-low at 6.6750 and then the 6.6161 Fibonacci level.
USDCNH Daily Price Chart
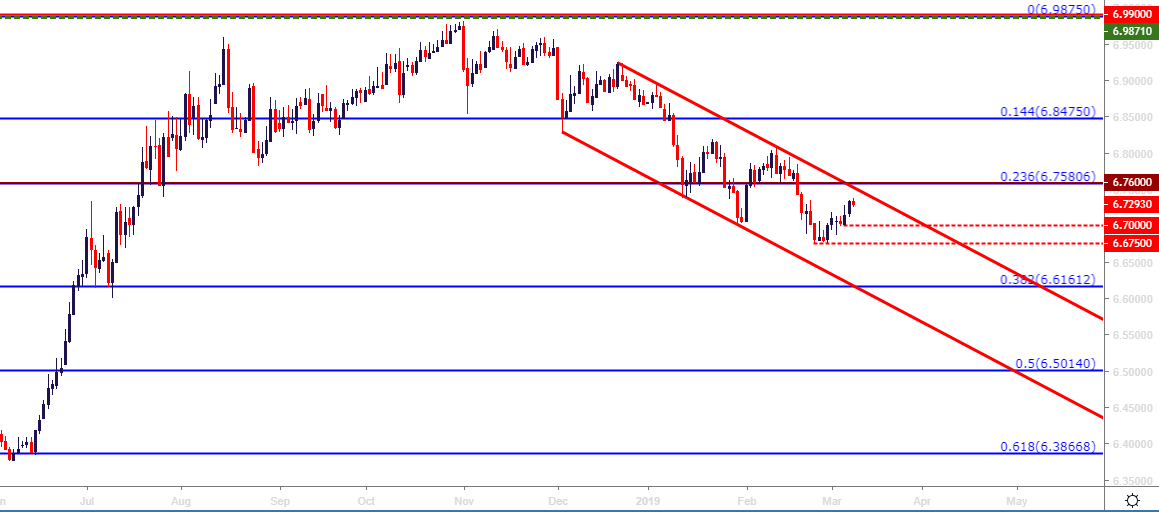
Chart prepared by James Stanley
To read more:
Are you looking for longer-term analysis on the U.S. Dollar? Our DailyFX Forecasts have a section for each major currency, and we also offer a plethora of resources on USD-pairs such as EUR/USD, GBP/USD, USD/JPY, AUD/USD. Traders can also stay up with near-term positioning via our IG Client Sentiment Indicator.
Forex Trading Resources
DailyFX offers a plethora of tools, indicators and resources to help traders. For those looking for trading ideas, our IG Client Sentiment shows the positioning of retail traders with actual live trades and positions. Our trading guides bring our DailyFX Quarterly Forecasts and our Top Trading Opportunities; and our real-time news feed has intra-day interactions from the DailyFX team. And if you’re looking for real-time analysis, our DailyFX Webinars offer numerous sessions each week in which you can see how and why we’re looking at what we’re looking at.
If you’re looking for educational information, our New to FX guide is there to help new(er) traders while our Traits of Successful Traders research is built to help sharpen the skill set by focusing on risk and trade management.
--- Written by James Stanley, Strategist for DailyFX.com
Contact and follow James on Twitter: @JStanleyFX


