


FX Price Action Setups in EURUSD, USDJPY and USDCAD
US Dollar Talking Points:
- If you’re looking to improve your trading approach, our Traits of Successful Traders research could help. This is based on research derived from actual results from real traders, and this is available to any trader completely free-of-charge.
- If you’re looking for a primer on the FX market, we can help. To get a ground-up explanation behind the Forex market, please click here to access our New to FX Trading Guide.
If you’d like to sign up for our webinars, we host an event on Tuesday and Thursday, each of which can be accessed from the below links:
Tuesday: Tuesday, 1PM ET
Thursday: Thursday 1PM ET
US Dollar Drops From Fibonacci Resistance to Fresh Weekly Low
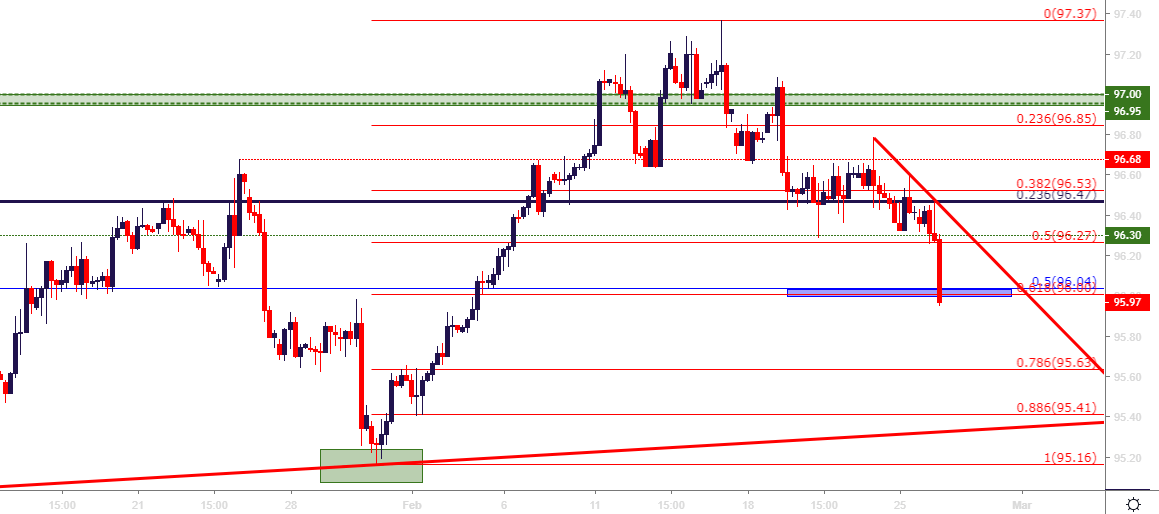
It’s been a busy morning in the US Dollar as FOMC Chair Jerome Powell began the bank’s twice-annual testimony in-front of Congress. This morning brought the Senate Finance Committee and tomorrow brings the House Financial Services Committee. While sounding fairly positive on the economy as a whole, Chair Powell remained non-committal to future rate hikes and this helped to bring on a move of USD-weakness.
Initially the US Dollar firmed after Powell’s opening statement, with resistance soon setting in off of the 96.47 Fibonacci level. But buyers could not hold the move and sellers soon came-in to push lower, and prices broke-below the 96.30 support that had held the lows since last week.
The next area of interest for USD support is the 96-96.04 support zone; and for short-term resistance, the prior area of support around 96.30 remains of interest.
(edit) while writing up the archive for the webinar (but before publishing), prices have broken down to the next support zone of interest.
US Dollar Hourly Price Chart
EURUSD Range Holds but Buyers Showing Less Enthusiasm
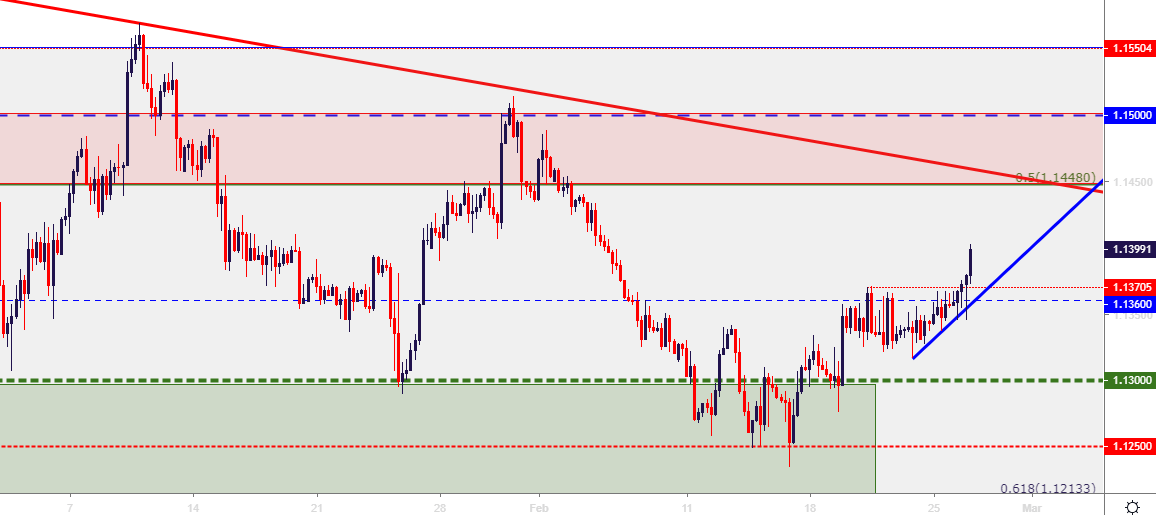
I’ve been looking at the EURUSD range over the past couple of weeks and that theme has continued to hold. The issue with the pair is short-term price action, as buyers have had a tendency to slow their approach as prices have tested resistance levels above the 1.1360 area; and current prices are quite far away from recent support to justify a move back to 1.1448. But with prices now tip-toeing above that resistance, can the door be opening for another test of the 1.1448-1.1500 longer-term resistance area?
EURUSD Four-Hour Price Chart
GBPUSD Puts in Aggressive Breakout
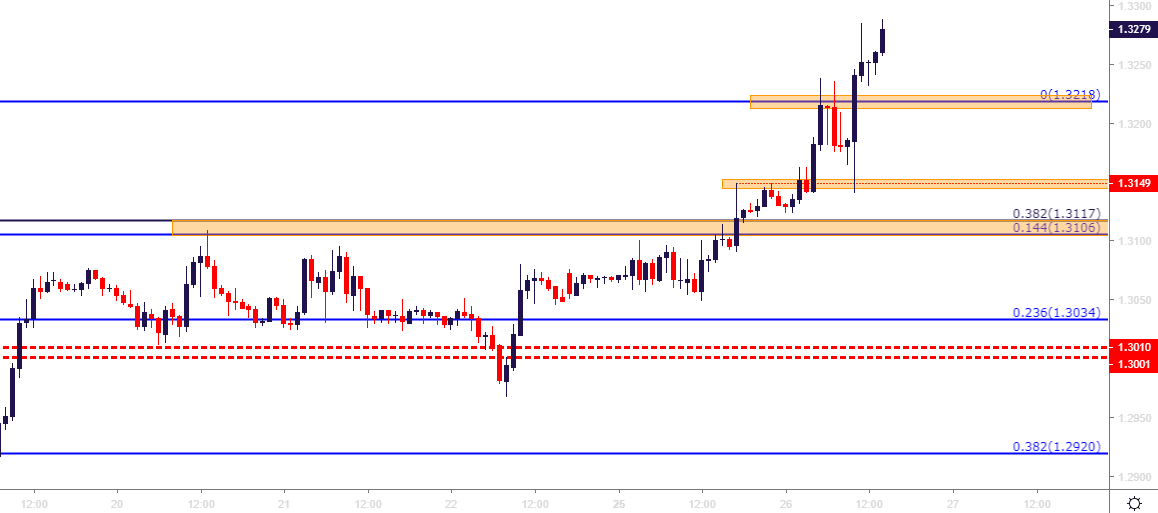
This morning brought some volatility to the British Pound around a report that Theresa May is preparing to delay the Brexit vote into March. This helped to propel GBPUSD up to fresh 2019 highs, and that move showed a pullback ahead of the Powell testimony. But, as USD-weakness came-in during the Q&A, GBPUSD pushed back up to fresh highs, running as high as 1.3285 before digesting that recent movement. As discussed in the webinar, this morning brought the potential for reversal scenarios; but given the continuation of the bullish move, that thesis no longer looks as attractive. For GBPUSD bulls or, for those looking for bearish-USD options, looking for topside continuation in GBPUSD may be an attractive theme. I looked at three possible pullback levels during the webinar that can be used for such a purpose.
GBPUSD Hourly Price Chart
USDCAD Holds Lower-High
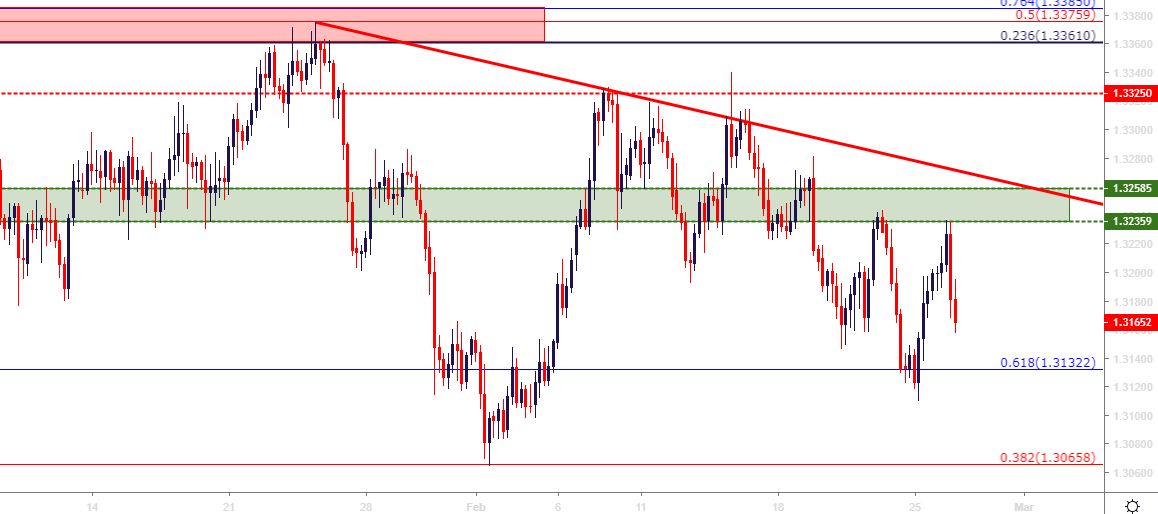
In USD/CAD, the pair has continued to show bearish tendencies as brought upon by lower-lows and lower-highs that have printed over the past few weeks. This setup appears to be very much tied with Oil prices, as the bullish bounce that showed in USDCAD at the start of this week appears correlated with the bearish push in WTI. As shared on Oil, this isn’t necessarily a directional change as much as an inflection, and this can keep the door opened for a bullish Oil thesis as well as bullish CAD, bearish USDCAD.
USDCAD Four-Hour Price Chart
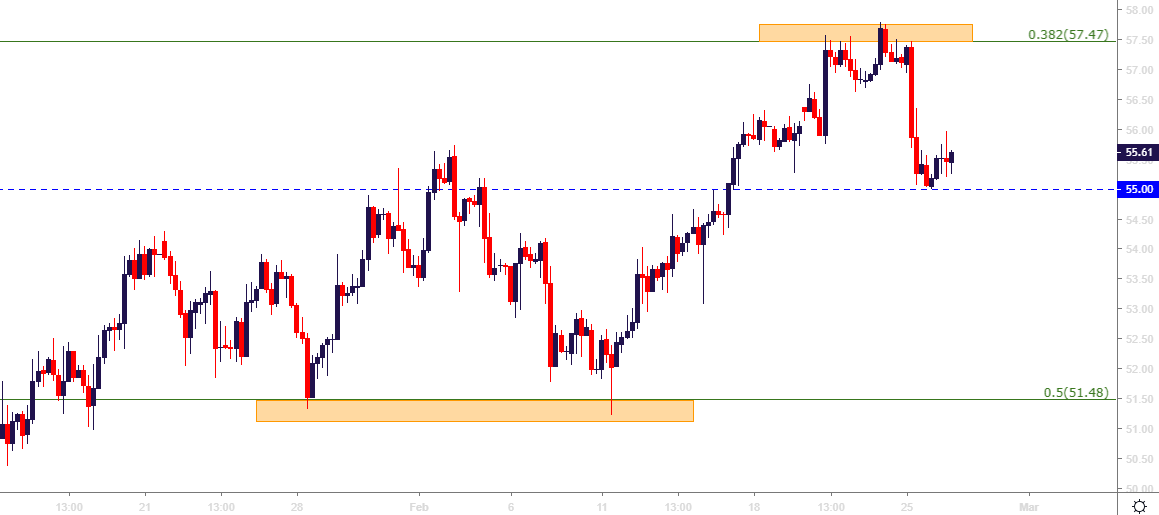
WTI Oil: Can Oil Bulls Stage a Defense of $55?
Oil prices softened yesterday after a specific tweet on the topic; but that pullback showed up at an interesting point on the Oil chart. The level of 57.47 is the 38.2% Fibonacci retracement of the 2016-2018 major move in WTI, and this is a price that started to show as resistance last week. So, at this point, that appears to be more of an inflection than a point of reversal.
The big question at this point is whether bulls will defend the $55 level, or whether another trip to the 51.48 level is in the cards, as this is the 50% marker of that same major move and previously helped to build-in a double-bottom formation in January and February of this year.
WTI US OIL Four-Hour Price Chart
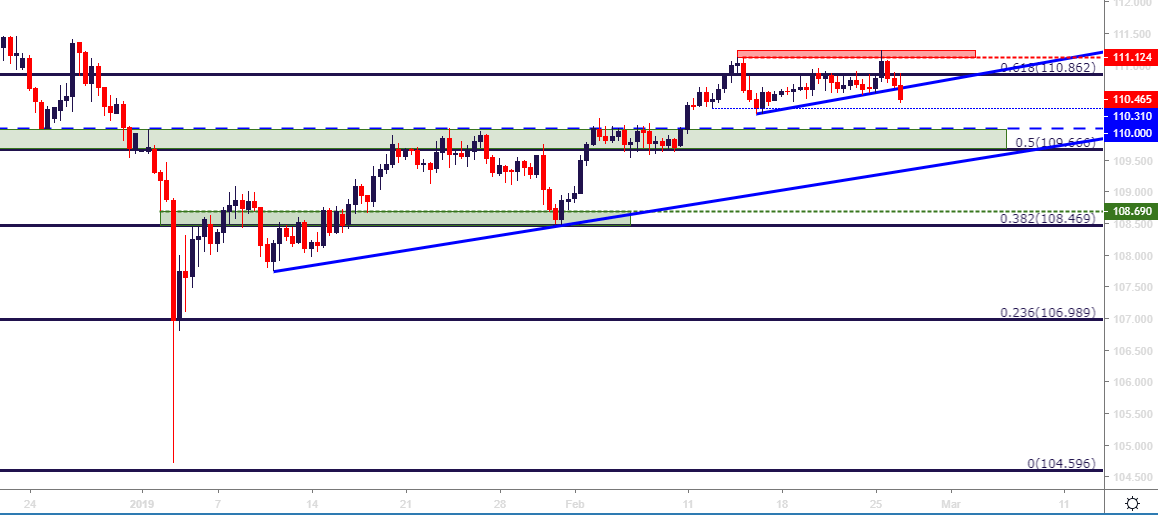
USDJPY Breakout Falters, Support at Prior Resistance?
Despite the US Dollar’s themes of weakness over the past week and a half, USDJPY has held up fairly well, all factors considered. This highlights just how weak the Japanese Yen has been of recent, and this can be evidenced in the GBPJPY chart shared below.
USDJPY put in a false breakout in the early portion of this week, and prices soon pulled back to find support around a bullish trend-line. Should USD-weakness continue to show, this can put the bullish theme in USDJPY further on the back-burner, opening the door for a re-test of support at the prior resistance zone of 109.67-110.00.
USDJPY Four-Hour Price Chart
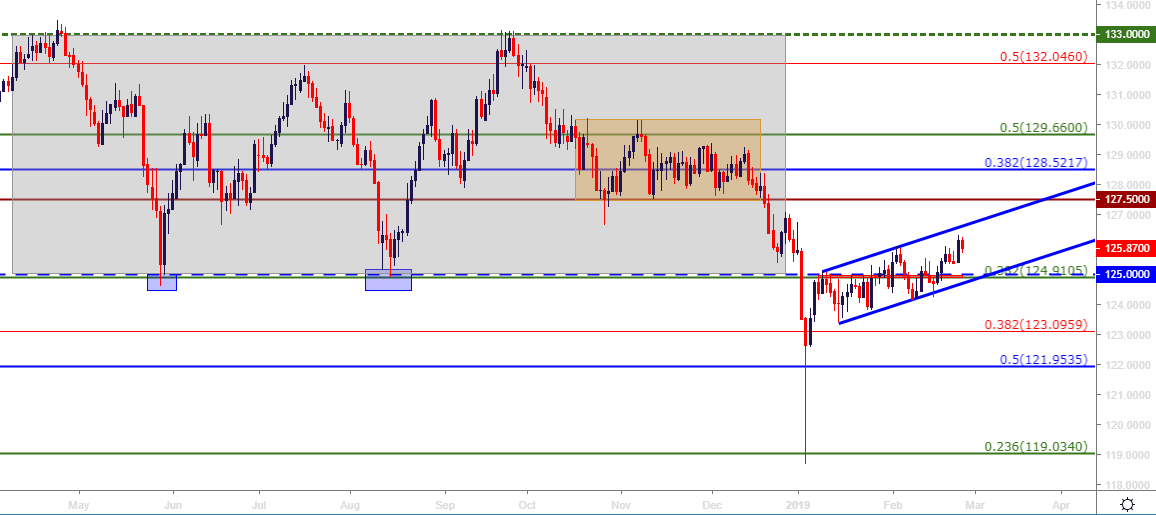
EURJPY Builds into Bear Flag
This is a longer-term observation, so it may take some time to get into a workable spot. But after the surge of Yen-strength to start the year, EURJPY has spent much of the time since building into a bullish channel. And as looked at in the webinar, the pair retains bullish qualities on short-term charts, so this formation may not yet be ready to work. But, this is something to keep on the radar in the event of another wave of ‘risk off’ themes through global markets.
EURJPY Daily Price Chart
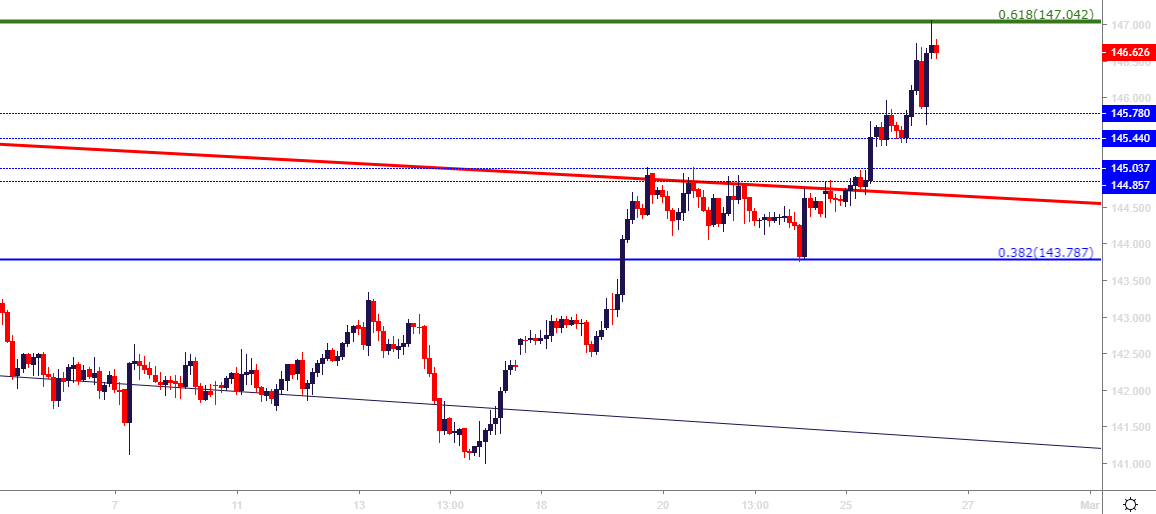
GBPJPY Tests Key Fibonacci Level – Reversal Potential
As shared in the webinar, this would have to be looked at as an extremely aggressive setup; but GBPJPY has put in significant strength so far today to run up to fresh three-month highs. Prices began to resist at the 147.04 level, which is the 61.8% retracement of the 2011-2015 major move in the pair; but perhaps more importantly this level has a plethora of recent inflections.
This can open the door to reversal potential. It could be seen as a lower-probability setup given the fact that this has been an aggressive topside breakout and the trader would, essentially, be looking for something ‘new’ to happen. But, it could present an attractive risk-reward ratio for those looking at or open to reversal setups.
GBPJPY Four-Hour Price Chart
USDCHF: Swissy Slides Back to Parity – Can Bears Push to .9902?
USDCHF is testing a big support zone now at the parity spot on the chart. Bears have yet to make a significant push back below the level but should USD-weakness remain as a theme in the near-term, this setup can remain attractive. For next supports, the .9902 Fibonacci level remains of interest after helping to set the late-January swing-low.
USDCHF Four-Hour Price Chart
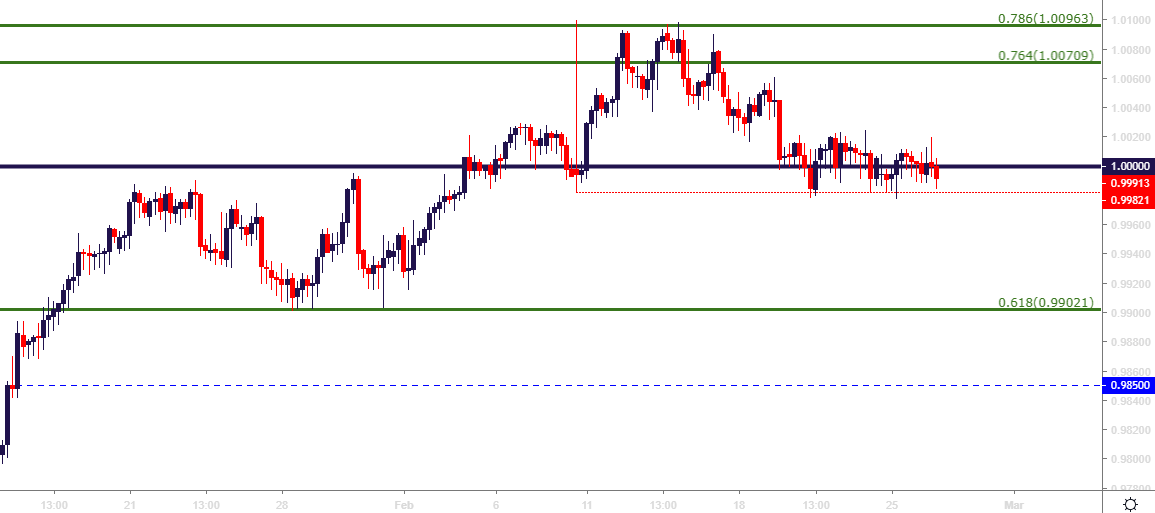
Chart prepared by James Stanley
To read more:
Are you looking for longer-term analysis on the U.S. Dollar? Our DailyFX Forecasts for Q4 have a section for each major currency, and we also offer a plethora of resources on USD-pairs such as EUR/USD, GBP/USD, USD/JPY, AUD/USD. Traders can also stay up with near-term positioning via our IG Client Sentiment Indicator.
Forex Trading Resources
DailyFX offers an abundance of tools, indicators and resources to help traders. For those looking for trading ideas, our IG Client Sentiment shows the positioning of retail traders with actual live trades and positions. Our trading guides bring our DailyFX Quarterly Forecasts and our Top Trading Opportunities; and our real-time news feed has intra-day interactions from the DailyFX team. And if you’re looking for real-time analysis, our DailyFX Webinars offer numerous sessions each week in which you can see how and why we’re looking at what we’re looking at.
If you’re looking for educational information, our New to FX guide is there to help new(er) traders while our Traits of Successful Traders research is built to help sharpen the skill set by focusing on risk and trade management.
--- Written by James Stanley, Strategist for DailyFX.com
Contact and follow James on Twitter: @JStanleyFX


