


US Dollar, EURUSD, GBPUSD Talking Points:
- This morning marks the start of the FOMC’s twice-annual Humphrey Hawkins testimony. Chair Powell is currently addressing the Senate Finance Committee, and tomorrow he heads back up Capitol Hill to address the House Financial Services Committee. While Chair Powell’s opening remarks were without any significant surprises, the US Dollar saw an initial topside move that pushed prices up to the 96.47 Fibonacci level, which is the 23.6% retracement of the 2011-2017 major move. Sellers soon showed up and prices pushed right back towards the Daily low.
- On a bigger-picture basis, the operative question is whether USD-bears might finally get some room to run. Prices are closing in on the 50% marker of the January bullish move which rests at 96.27. A deeper push of USD-weakness could make the topside of EURUSD as an attractive venue as traders look for the multi-month range to fill-in.
- DailyFX Forecasts are published on a variety of currencies such as the US Dollar or the Euro and are available from the DailyFX Trading Guides page. If you’re looking to improve your trading approach, check out Traits of Successful Traders. And if you’re looking for an introductory primer to the Forex market, check out our New to FX Guide.
Do you want to see how retail traders are currently trading the US Dollar? Check out our IG Client Sentiment Indicator.
US Dollar Poses Mild Bounce on Powell Testimony That’s Mostly Faded-Out Already
Today marks Day One of the Fed’s twice-annual report to Congress, often called ‘Humphrey Hawkins testimony.’ FOMC Chair Jerome Powell is currently addressing the Senate, and tomorrow he marches back up Capitol Hill to address the House Financial Services Committee. As discussed earlier this morning by our own Justin McQueen, the opening statement from Chair Powell was without any significant surprises, as he reiterated patience on rate guidance despite continued signs of solid growth in the US.
The net impact thus far has been a mild bounce in the US Dollar. DXY firmed from an overnight low of 96.26 to re-engage with the Fibonacci level at 96.47 for short-term resistance. Sellers showed reaction to that resistance and at this point, USD is almost back to where it started before Powell began to speak.
US Dollar Hourly Price Chart
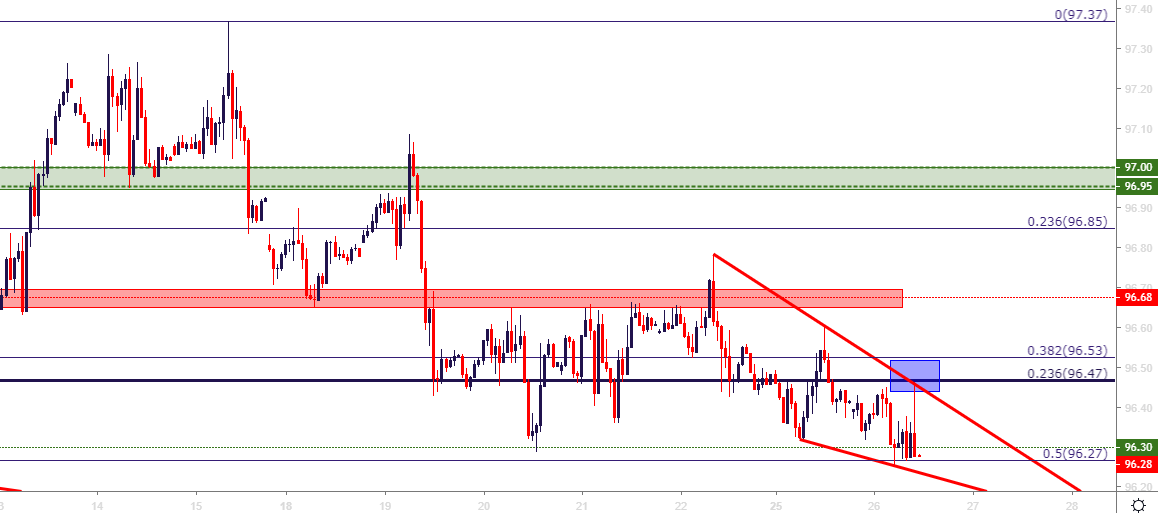
Chart prepared by James Stanley
On a larger basis, the big question is whether USD-bears might get some room to run, or whether the bullish trend in the Greenback re-invigorates as month-end nears. The first-half of February was noticeably bullish in the US Dollar on the heels of the January FOMC rate decision. Last week saw that strength begin to pullback, and at this point, the 50% marker of that bullish run is coming-in to help set today’s low.
Underneath current price action rests a confluent zone of support potential around the 96-handle on DXY. The level of 96.00 is the 61.8% retracement of the prior bullish trend while 96.04 is the 50% marker of the 2017-2018 sell-off in the currency.
US Dollar Four-Hour Price Chart
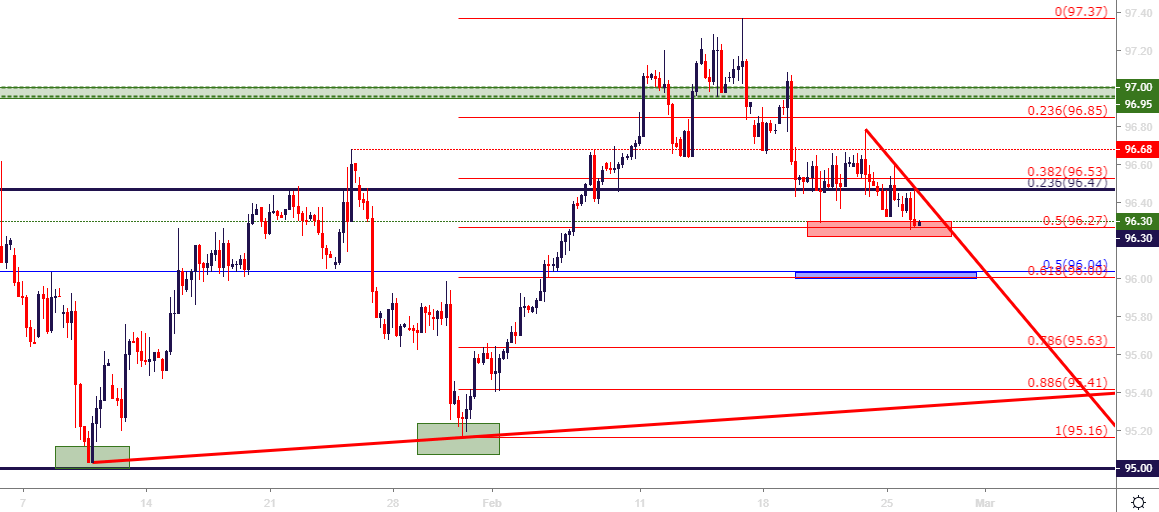
Chart prepared by James Stanley
EURUSD Edges Higher; Buyers Thus Far Unenthused Beyond 1.1371
The range in EURUSD has continued to hold despite a seeming lack of excitement from bulls. The range formation in the pair has been in-play for more than three months now with support holding the bottom-side of price action through a number of key issues. The spark of strength in the US Dollar at the February open helped to drive prices from range resistance down to support; and last week saw that support cauterize before buyers were able to pose an initial lift away from the 1.1300 handle.
But, as discussed yesterday, buyers have shown little tolerance for EURUSD prices above the 1.1360-level. So, while traders have been coming in to furnish higher-lows in the pair’s short-term price action, a horizontal zone of resistance has thus far held the highs. This could open the door to short-term breakout potential, looking for the pair to make a move towards the resistance side of the longer-term range that runs from 1.1448-1.1500.
EURUSD Four-Hour Price Chart
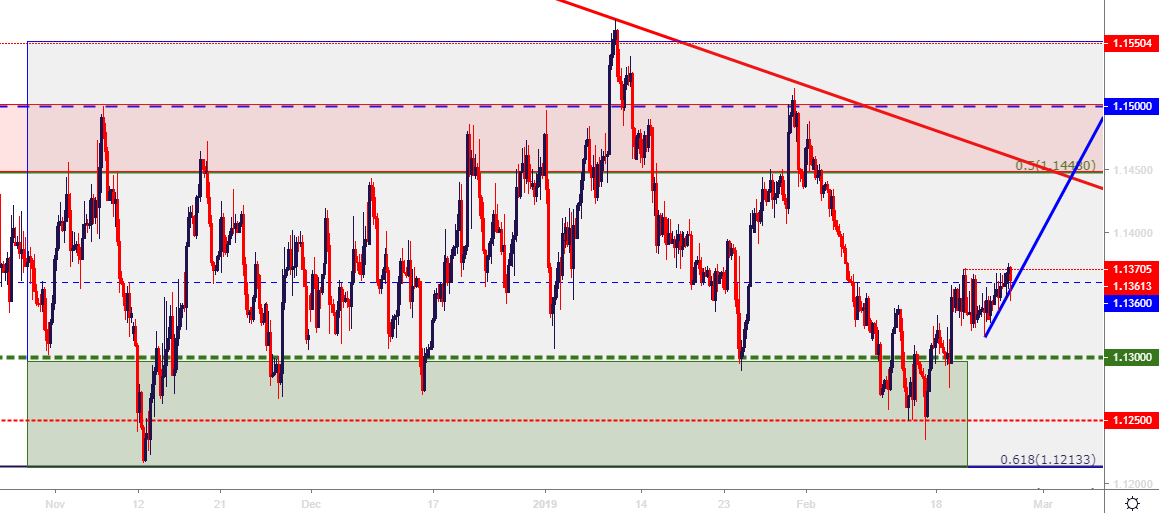
Chart prepared by James Stanley
GBPUSD: Cable Volatility Re-Appears After Test of Five-Month Highs
It’s been a busy morning around the British Pound, as a rumor denoting that PM May could be considering a delay to the Brexit vote helped to elicit a flicker of strength in GBP. This created a quick topside move that saw the pair move up to test fresh five-month highs, temporarily trading above the 1.3218 level that previously marked the 2019 high watermark.
But that strength could not hold, and prices soon pushed back to find support at the 1.3150-area. This presents a couple of different interesting prospects around GBPUSD: For traders looking to buy USD, the potential for reversals in GBPUSD can be an attractive thesis as traders look to fade fresh five-month highs. Prior areas of resistance from 1.3106-1.3117, or the area from 1.3000-1.3034 could be attractive areas to look for follow-through supports.
GBPUSD Four-Hour Price Chart
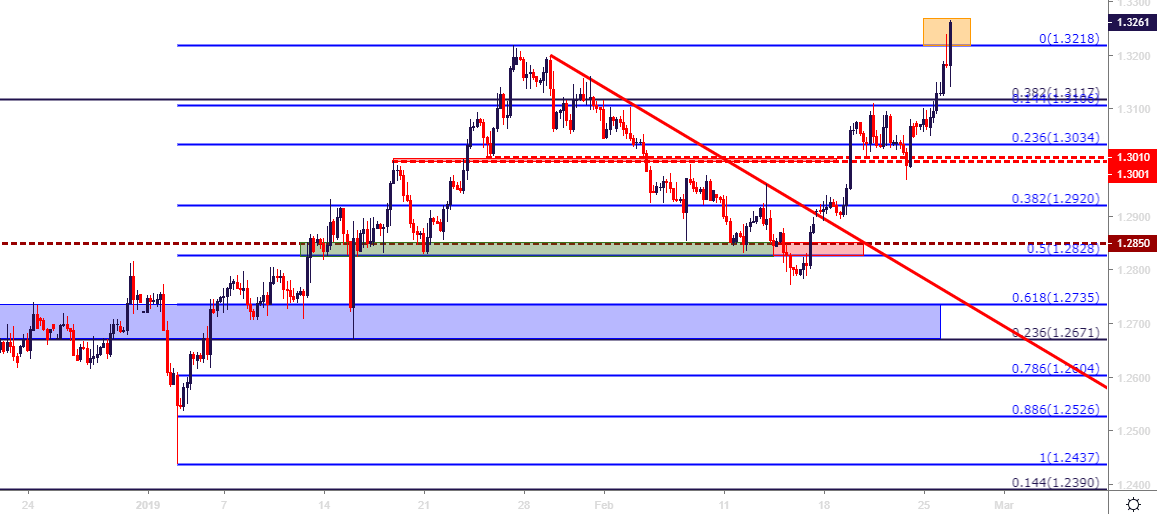
Chart prepared by James Stanley
On a shorter-term basis, given the drivers in the backdrop, traders could potentially look for the substantiation of a fresh trend. This would likely need to be coupled with a bearish-USD thesis; but given the consistency with which this move has priced-in over this week, traders could look for a continuation of higher-highs and higher-lows.
GBPUSD Hourly Price Chart
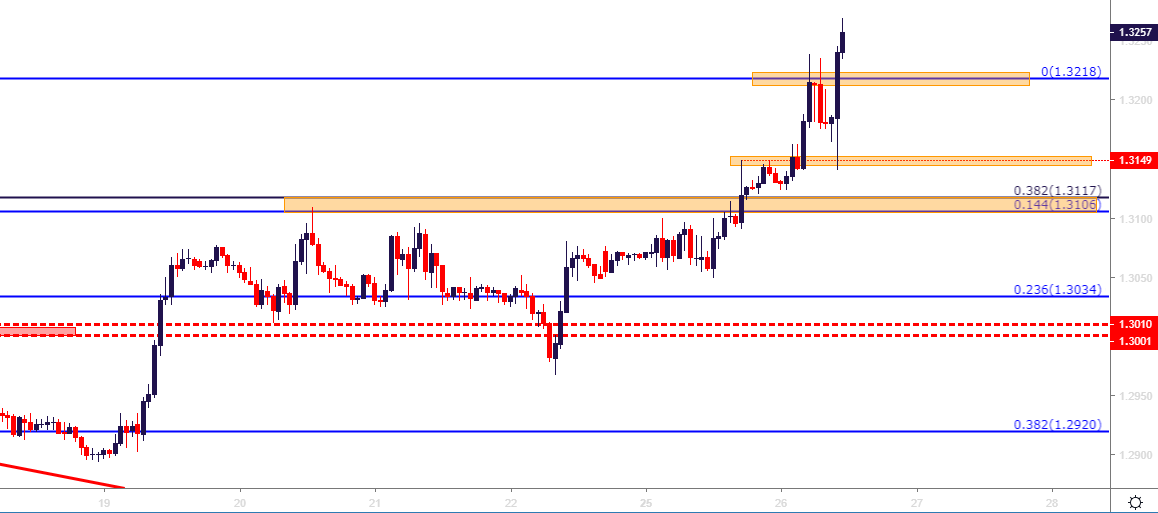
Chart prepared by James Stanley
To read more:
Are you looking for longer-term analysis on the U.S. Dollar? Our DailyFX Forecasts have a section for each major currency, and we also offer a plethora of resources on USD-pairs such as EUR/USD, GBP/USD, USD/JPY, AUD/USD. Traders can also stay up with near-term positioning via our IG Client Sentiment Indicator.
Forex Trading Resources
DailyFX offers a plethora of tools, indicators and resources to help traders. For those looking for trading ideas, our IG Client Sentiment shows the positioning of retail traders with actual live trades and positions. Our trading guides bring our DailyFX Quarterly Forecasts and our Top Trading Opportunities; and our real-time news feed has intra-day interactions from the DailyFX team. And if you’re looking for real-time analysis, our DailyFX Webinars offer numerous sessions each week in which you can see how and why we’re looking at what we’re looking at.
If you’re looking for educational information, our New to FX guide is there to help new(er) traders while our Traits of Successful Traders research is built to help sharpen the skill set by focusing on risk and trade management.
--- Written by James Stanley, Strategist for DailyFX.com
Contact and follow James on Twitter: @JStanleyFX


