


Forex Setups for the Week of November 12, 2018
- DailyFX Quarterly Forecasts have been updated for Q4, and are available directly from the following link: DailyFX Trading Guides, Q4 Forecasts.
- For trading ideas, please check out our Trading Guides. And if you’re looking for something more interactive in nature, please check out our DailyFX Live webinars.
- If you’d like more color around any of the setups below, join in our live DailyFX webinars each week, set for Tuesday and Thursday at 1PM Eastern Time. You can sign up for each of those sessions from the below link:
Tuesday: Tuesday, 1PM ET
Thursday: Thursday 1PM ET
Do you want to see how retail traders are currently trading the US Dollar? Check out our IG Client Sentiment Indicator.
Dip, then Rip. Back to 97 for the US Dollar
It was another busy week across global markets, particularly the US as mid-term elections on Tuesday led into a Federal Reserve rate decision on Thursday. While global risk rallies continued in the aftermath of election results, those risk-on themes started to come into question on Thursday after the FOMC rate decision. While the bank did keep rates on hold while posing only mild changes to last month’s statement, global risk markets did not seem to take that meeting in stride as the bullish outlay from the early portion of the week was stopped dead in its tracks, followed by a pullback Friday.
Next week sees another large risk item come back to light, and that’s the brewing situation between Italy and the European Commission. Tuesday marks the due date for the revised Italian budget and, going on comments over the last couple of days, it does not appear that the two sides are yet nearing a compromise. This is the same theme that delivered a dose of risk aversion in April and May, and again in late-September running into October; and next week brings a similar backdrop of worry as attention will shift back towards a rather pensive situation still brewing in Europe.
The US Dollar is putting in another test of the 97.00 level and, much like last week, that Dollar strength appears to be unevenly distributed. For next week, I want to continue to look for USD strength through the Euro while directing strategies for USD-weakness elsewhere. Over the past two weeks , I’ve looked at both AUD/USD and NZD/USD for such plays, and the door remains open on each of those as I discussed in yesterday’s webinar. Those setups are largely in a similar spot as yesterday, so in the aim of avoiding redundancy, I will direct this week’s short-side USD setups elsewhere.
US Dollar Eight-Hour Price Chart: Back to 97.00 After Earlier-Week Trend-Line Test
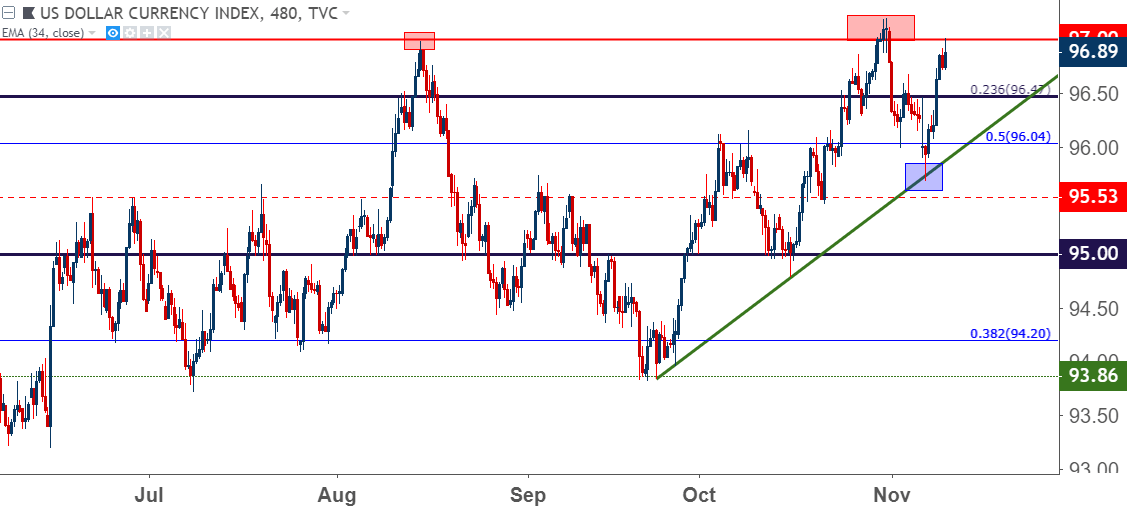
Chart prepared by James Stanley
Bearish EUR/USD for USD-Strength Strategies
EUR/USD will likely be a focal point for the FX market next week as the situation between the European Commission and Italy comes into further view. This has been my preferred venue for USD-strength over the past few weeks, using a zone of prior support as fresh resistance that runs from 1.1448-1.1500. The level of 1.1448 came in last Friday to help mark the high and the 1.1500 handle came into play on Wednesday of this week, helping to quell the bullish move that had shown so far through November trade.
EUR/USD has been selling off over the past two days but, as of yet, sellers have been unable to take-out 1.1300, and this can make matters of entry difficult given proximity to support and resistance. For next week I want to look at short-side EUR/USD strategies in one of two different ways: Either a down-side break of the 1.1300 low, which can open the door for bearish breakout strategies. Or, a pullback to lower-high resistance around a level of prior support. Such an area exists from 1.1395-1.1430, which could allow for risk levels to be set outside of this week’s high at 1.1500.
EUR/USD Eight-Hour Price Chart
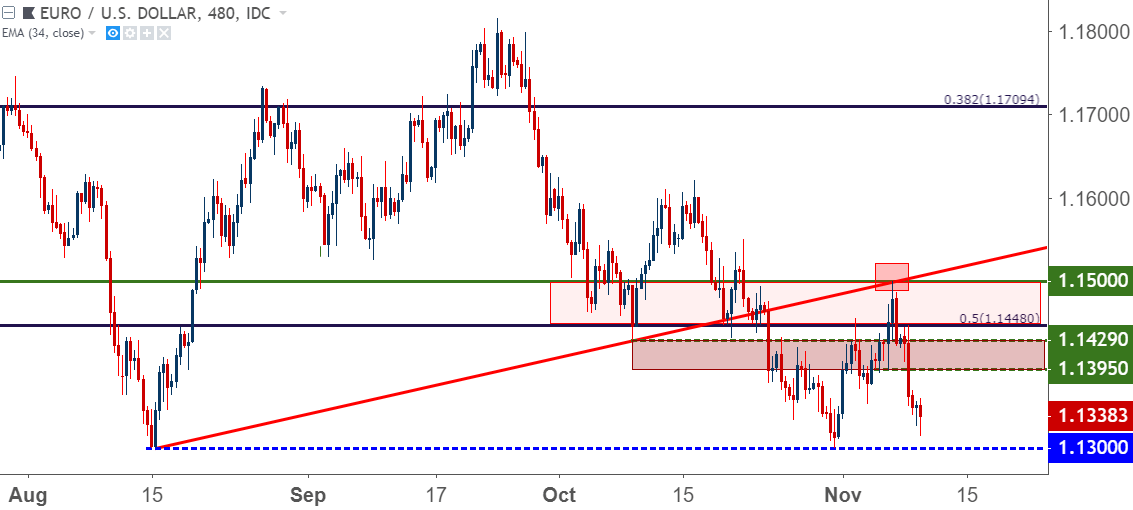
Chart prepared by James Stanley
Bearish USD/CNH Below 6.9900
Dollar-Yuan has jumped by 12% from the March lows up to the October high, and this is a theme that has a bit of political importance as it speaks to the continued rift around tariff discussions. The pair has a multi-year high of 6.9875, and the Yuan was fixed-higher in early November as the pair inched closer to a re-test of that level. As these multi-year highs come closer to being in play, the matter becomes more attention-grabbing as it carries indications of trade tensions between China and the US; carrying with it more media attention into an already pensive situation, and this seems like a scenario that the PBoC might want to avoid, at least for now.
This can open the door to reversal setups in the pair, with stops located above the 6.9900-handle to get risk levels above the multi-year high, along with initial targets set to 6.9000 and secondary targets towards the early-November low around 6.8500.
USD/CNH Monthly Price Chart: Inching Closer to the Multi-Year High
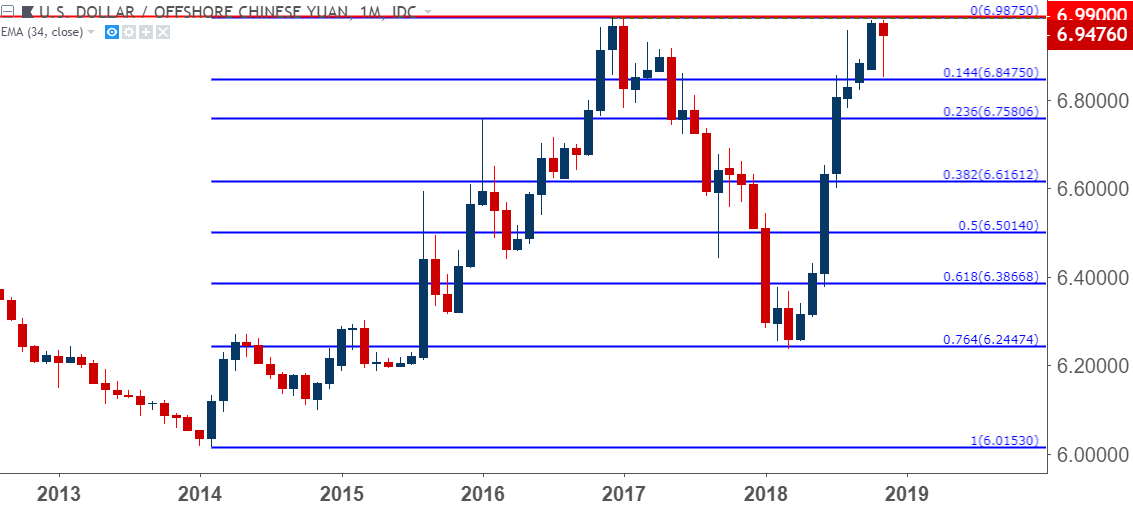
Chart prepared by James Stanley
Bearish USD/CHF Below 1.0150
A bit of turbulence has begun to show in USD/CHF as the pair battles around a key area of resistance at 1.0071. This is the 23.6% Fibonacci retracement of the 2016-2018 major move in the pair, and this is the same level that helped to mark the high in July of this year before a bearish reversal came into play.
The bullish advance in USD/CHF has been going for a month-and-a-half now, and this level of resistance has helped to cap the highs for the past week-and-a-half. This can open the door to reversal setups with stops lodged above the 1.0150 level, and initial targets set towards .9950. Secondary targets can be directed towards the Fibonacci level at .9902. And if the setup does show strong reversal potential next week, additional exits could be plotted around .9850 and then the support zone from .9750-.9767.
USD/CHF Weekly Price Chart: In the 2018 Resistance Zone

Chart prepared by James Stanley
To read more:
Are you looking for longer-term analysis on the U.S. Dollar? Our DailyFX Forecasts for Q4 have a section for each major currency, and we also offer a plethora of resources on USD-pairs such as EUR/USD, GBP/USD, USD/JPY, AUD/USD. Traders can also stay up with near-term positioning via our IG Client Sentiment Indicator.
Forex Trading Resources
DailyFX offers a plethora of tools, indicators and resources to help traders. For those looking for trading ideas, our IG Client Sentiment shows the positioning of retail traders with actual live trades and positions. Our trading guides bring our DailyFX Quarterly Forecasts and our Top Trading Opportunities; and our real-time news feed has intra-day interactions from the DailyFX team. And if you’re looking for real-time analysis, our DailyFX Webinars offer numerous sessions each week in which you can see how and why we’re looking at what we’re looking at.
If you’re looking for educational information, our New to FX guide is there to help new(er) traders while our Traits of Successful Traders research is built to help sharpen the skill set by focusing on risk and trade management.
--- Written by James Stanley, Strategist for DailyFX.com
Contact and follow James on Twitter: @JStanleyFX


