


Forex Talking Points:
- Equity markets are pulling back a bit after the strong topside runs that developing during the first week of November. This has come along with a pullback in that prior theme of US Dollar strength, which ran into trend-line support on Wednesday of this week. With the US Dollar (DXY) re-approaching the 97.00 level as European worries begin to show again around FX markets, might another bearish turn be around-the-corner for global equities?
- Next week brings the due date for the revised budget out of Italy, and at this point neither side looks ready to give. The European Commission continues to contend that Italy’s growth forecasts are far too high to justify their proposed deficit, while Italy claims that the European Commission is using a sub-optimal forecast model. Next Tuesday, November 13th, is when the revised budget is due from Italy – but will they cave to Brussels’ demands?
- DailyFX Forecasts on a variety of currencies such as the US Dollar or the Euro are available from the DailyFX Trading Guides page. If you’re looking to improve your trading approach, check out Traits of Successful Traders. And if you’re looking for an introductory primer to the Forex market, check out our New to FX Guide.
Do you want to see how retail traders are currently trading the US Dollar? Check out our IG Client Sentiment Indicator.
Return of the Risk Trade Under Review as European Worries Move Back to Main Stage
It’s been an encouraging November thus far, for the most part, and this follows what had become a worrisome month of October as the risk trade pretty much collapsed the world-around. While all of the Dow, Nasdaq 100 and S&P 500 all set fresh all-time-highs in the first few days of Q4, the rest of last month was spent witnessing varying forms of pressure in global risk markets. This was accompanied by a swell of US Dollar strength on the back of risk aversion themes as a bevy of threats produced a concerning backdrop. Among those drivers was the recently completed mid-term elections, continued rising rates out of the US, a tariff scenario that still hasn’t found resolution, a number of questions around Brexit and, perhaps most concerning of all, a potential debt stand-off between Italy and the European Commission.
DJIA Four-Hour Price Chart: October Pain Leads into November Gains – But Can Buyers Hold the Line?
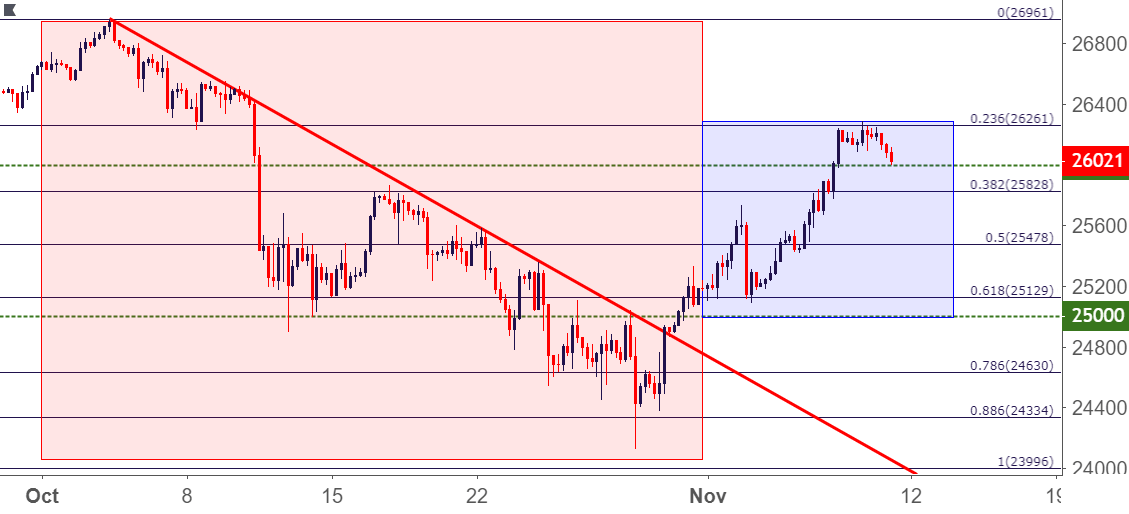
Chart prepared by James Stanley
Some of these items have calmed, lending to recovery that’s been strung together so far in the month. Mid-terms concluded (at least in most jurisdictions) in a fairly market-friendly manner, and yesterday saw an optimistic Donald Tusk speak on the prospect of Brexit progress.
EUR/USD Threatens Yearly Low as Euro Worries Move Back into the Spotlight
Still outstanding, however, and a potential point of worry for equity bulls is the scenario that continues to develop between the European Commission and the Italian government. Next week, November 13th, marks the date that the revised budget is due to Brussels. This week saw a slate of discouraging developments on that front. The European Commission says that Italy’s grown projections are too high, while Italy claims that the EC is using an ‘inadequate and partial’ analysis of the economy in their projections. This matters because it’s those very same growth projections that will help Italy set spending forecasts for the next two years, and there remains a chasm of difference between what’s wanted between Brussels and Rome.
EUR/USD Four-Hour Price Chart: Sellers Return at 1.1500 to Eradicate November Gains
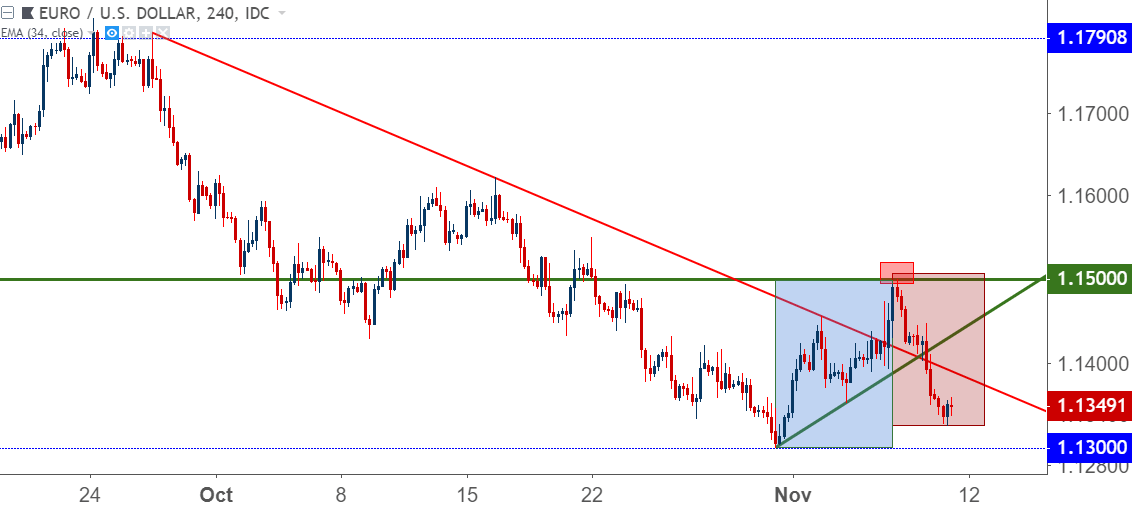
Chart prepared by James Stanley
Earlier today, Italy’s Economic Minister, Giovanni Tria, said that Brussels’ demands on deficit cuts would be ‘suicide’ for the Italian economy. And yesterday the IMF warned that Italy was vulnerable amid rising rates, and that countries with ‘weaker macroeconomic fundamentals and limited policy buffers’ could face hardships as there is ‘appreciable uncertainty, and contagion from future stress could be notable.’ So, it would appear that we’re nowhere near resolution in that scenario, and in response Italian bonds have continued to sell-off as yields hit their highest level in a week on the back of these developments.
In the European currency, price action had started to build into a bullish backdrop in November trade, partially assisted by a pullback in the US Dollar; but that theme of strength seemingly sold-out with yesterday’s break of support. This could be a difficult market to work with ahead of the weekend as prices remain very near that yearly low. The price of 1.1300 has twice rebuked bearish trends over the past few months: First in mid-August and then again in late-October. A third test may not be able to hold the lows, but a lack of nearby resistance makes the prospect of entry a bit less attractive given risk-reward potential down to 1.1300.
EUR/USD Eight-Hour Price Chart: Drop from 1.1500 Slows Down as 1.1300 Support Nears
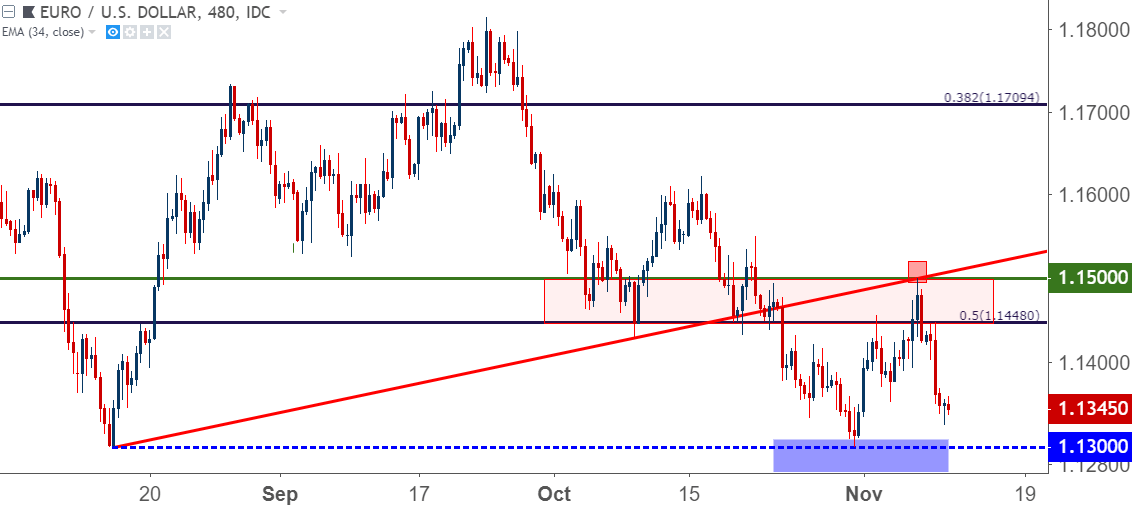
Chart prepared by James Stanley
This could open the door to bearish breakout strategies on prints of new lows after next week’s open. Or, alternatively, a pullback to an area a bit closer to short-term resistance that could allow for adequate risk management for bearish approaches, and I’ve outlined two possible areas inside of the resistance zone on the below chart; around 1.1395 and then 1.1430.
EUR/USD Two-Hour Price Chart
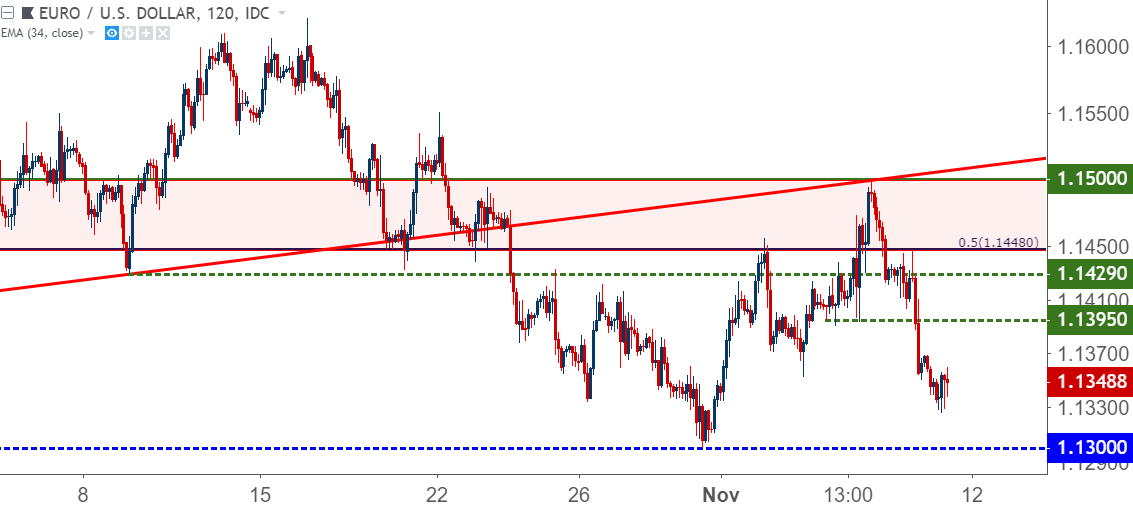
Chart prepared by James Stanley
GBP/USD: Brexit Optimism Brings Support Bounce to the British Pound
The British Pound has enjoyed a strong month of November as the currency clawed-back losses from last month’s bearish run. In the first week of the new month, prices retraced 88.6% of the bearish move from last month, finding a bit of resistance at the 1.3174 area on the chart; and the past two days have produced a pullback to a key zone of support that I had looked at on Wednesday of this week.
GBP/USD Two-Hour Price Chart: Support at 1.3000
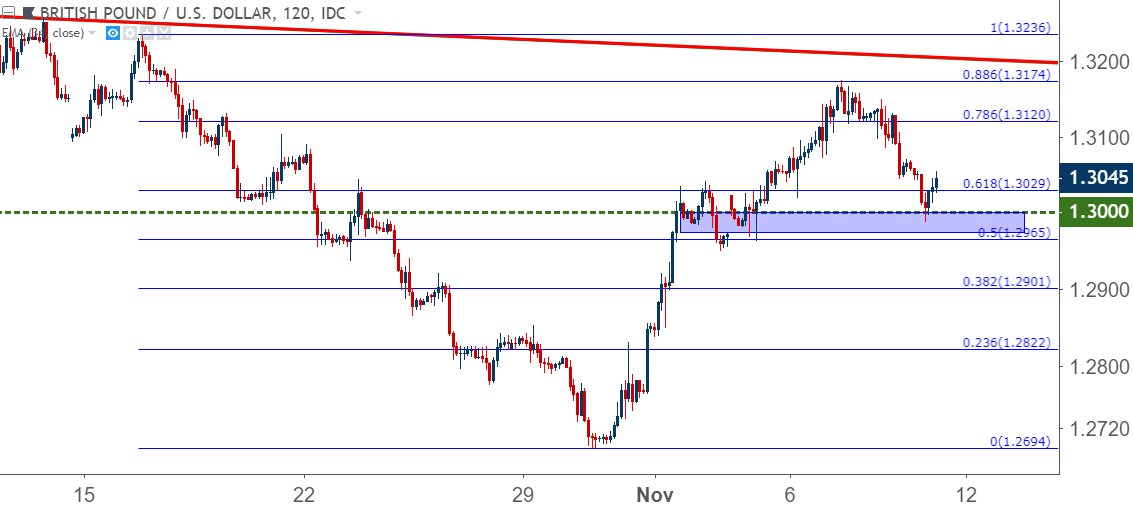
Chart prepared by James Stanley
At this stage, prices have produced a fairly respectable hold of support around the 1.3000 psychological level, and this could keep the door open for bullish approaches as we move into next week. It is notable that Brexit dynamics appear to be quite optimistic at this point; and if the past two years of post-Brexit analysis has taught us anything, it’s that optimism can quickly turn as politics produces fracture. So this would likely remain a pensive situation that investors would want to continue to be careful around.
GBP/USD Daily Price Chart: A Jagged Past Four Months of Price Action as Brexit Makes Waves
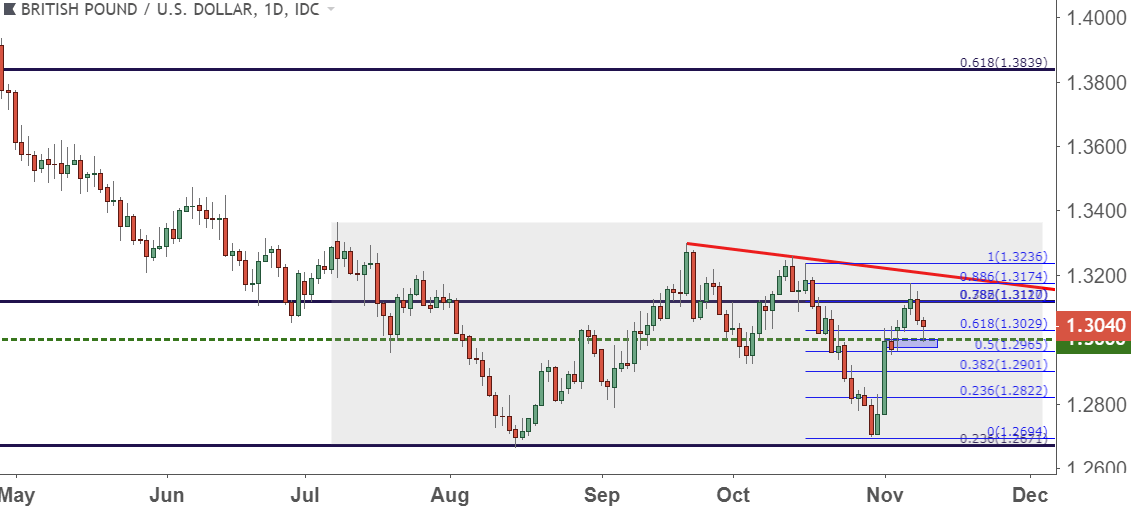
Chart prepared by James Stanley
US Dollar Re-Approaches 97.00 – Third Time the Charm?
The US Dollar has moved along with those risk trends, showing strength in October and pulling back in November as calm started to show. As I had looked at on Wednesday, prices in the Greenback had pulled back to a key trend-line that connects September and October swing-lows, and this helped to bring back strength into the currency with DXY now making a fast approach at the 97.00 level.
US Dollar Four-Hour Price Chart: Trend-Line Bounce Extends Through FOMC
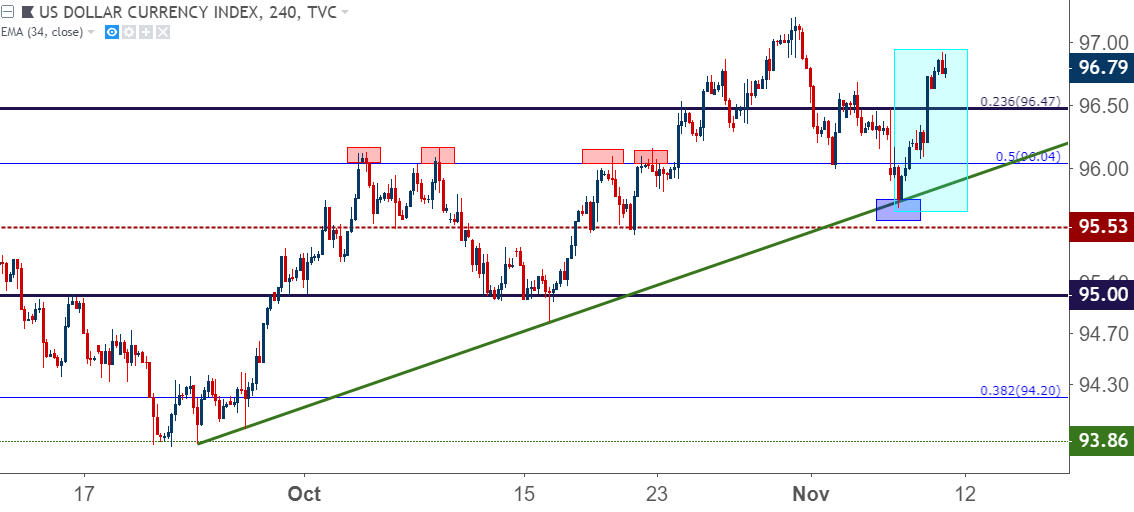
Chart prepared by James Stanley
There’s been a bit of drama around 97.00 so far this year: The August run fell just short of that level, and the October move broke-through, if even for just a day as sellers came in with the November open.
Will buyers be able to successfully break-through on a third attempt? This will likely be linked in some way with dynamics in EUR/USD and whether the pair can break-below the 1.1300 handle. If we see risk aversion come back next week, that 97.00 level is exposed and we will likely see a third test.
US Dollar Daily Price Chart: Third Time the Charm for DXY at 97?
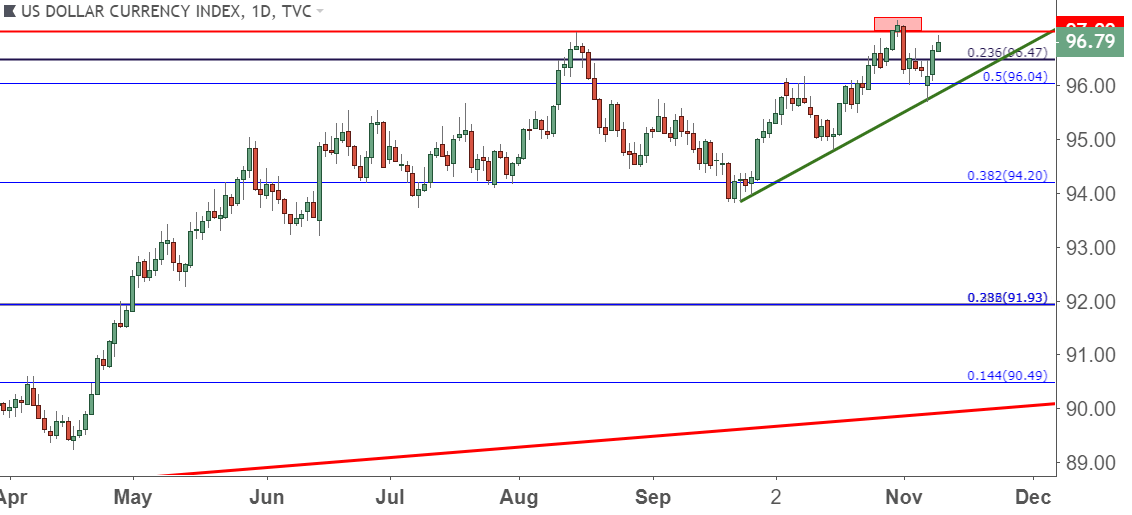
Chart prepared by James Stanley
To read more:
Are you looking for longer-term analysis on the U.S. Dollar? Our DailyFX Forecasts for Q4 have a section for each major currency, and we also offer a plethora of resources on USD-pairs such as EUR/USD, GBP/USD, USD/JPY, AUD/USD. Traders can also stay up with near-term positioning via our IG Client Sentiment Indicator.
Forex Trading Resources
DailyFX offers a plethora of tools, indicators and resources to help traders. For those looking for trading ideas, our IG Client Sentiment shows the positioning of retail traders with actual live trades and positions. Our trading guides bring our DailyFX Quarterly Forecasts and our Top Trading Opportunities; and our real-time news feed has intra-day interactions from the DailyFX team. And if you’re looking for real-time analysis, our DailyFX Webinars offer numerous sessions each week in which you can see how and why we’re looking at what we’re looking at.
If you’re looking for educational information, our New to FX guide is there to help new(er) traders while our Traits of Successful Traders research is built to help sharpen the skill set by focusing on risk and trade management.
--- Written by James Stanley, Strategist for DailyFX.com
Contact and follow James on Twitter: @JStanleyFX


