


In this webinar, we used price action to look at macro markets as the US Dollar bounced from the support zone that we’ve been following over the past week. In our webinar on Tuesday, we saw prices starting to test the topside of that zone. Price action continued to drive-lower yesterday, and bulls finally began to show with a bit more prominence earlier this morning. This sets the stage for an interesting start to the Jackson Hole Economic Symposium, due to start tomorrow and run through the weekend.
Talking Points:
- If you’re looking to improve your trading approach, our Traits of Successful Traders research could help. This is based on research derived from actual results from real traders, and this is available to any trader completely free-of-charge.
- If you’re looking for a primer on the FX market, we can help. To get a ground-up explanation behind the Forex market, please click here to access our New to FX Trading Guide.
If you’d like to sign up for our webinars, we host an event on Tuesday and Thursday, each of which can be accessed from the below links:
Tuesday: Tuesday, 1PM ET
Thursday: Thursday 1PM ET
US Dollar Bounces From Support Ahead of Jackson Hole
We’ve looked at the support zone in the US Dollar a couple of times this week, most recently this morning as the bottom-portion of the zone was continuing to face tests. This took place around the price of 95.00, which had also served as the swing-high in the currency in May of this year. Throughout today’s US session, USD strength remained and prices started to move out of the zone, indicating alignment of both short and longer-term themes of strength. This keeps the door open for bullish continuation in the Greenback.
US Dollar Eight-Hour Price Chart: Bullish Structure Remains

Chart prepared by James Stanley
EUR/USD Falls From ‘R3’ Resistance
We looked at short-side plays in EUR/USD as part of our FX Setups of the Week, and while the first portion of the week saw a bullish Euro punch through the first two of those zones, resistance appears to have caught at ‘r3’ as sellers are re-grasping control. This was the same zone of confluent resistance that showed up earlier in the month just ahead of the impulsive push to fresh lows. This keeps the door open for bearish continuation in the pair as we move towards tomorrow’s Jackson Hole Symposium.
EUR/USD Eight-Hour Price Chart: Resistance Reaction at ‘R3’ Zone – Can Sellers Continue to Push?
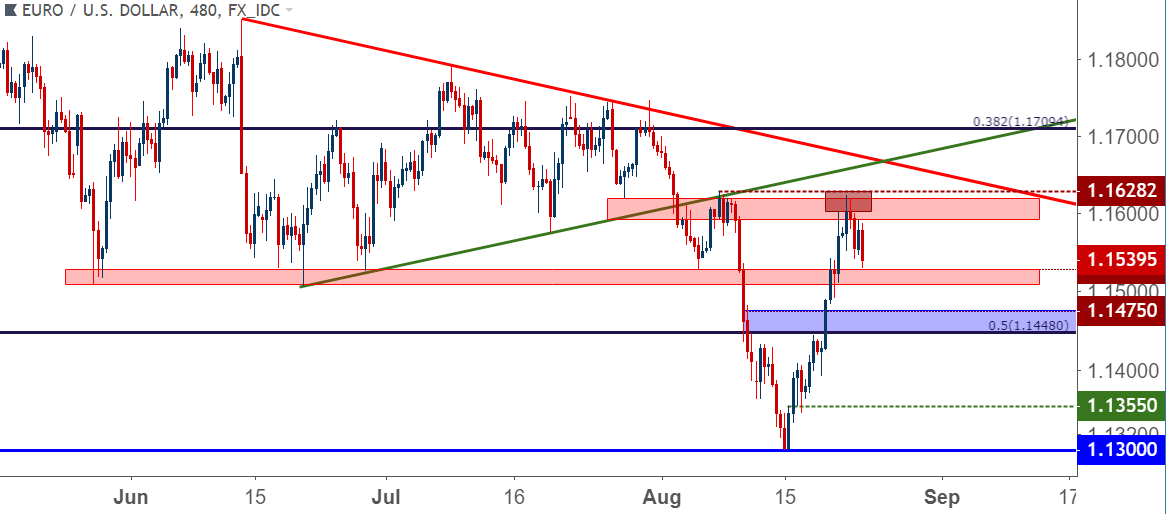
Chart prepared by James Stanley
GBP/USD From Support to Resistance and Back
We looked at bullish setups in GBP/USD this week, largely on the basis of just how bearish and oversold the move had gotten last week. After a big-picture Fibonacci level came into play at 1.2671 as this is the 23.6% retracement of the ‘Brexit move,’ that flow began to shift as buyers started to take control. We previously used the zone of resistance at 1.2817-1.2846 to sell the pair last week, just ahead of those fresh lows. But after support showed and buyers began to drive, we shifted to a bullish stance and began to look for targets/resistance in that same zone. After that was soon met, prices jumped up to the second zone of resistance that we were following at 1.2917-1.2956. That came into play this morning, at which point prices began to drop again – and at this stage we’re seeing support in that same 1.2817-1.2846 zone.
This is a market devoid of attractive short-term setups at the moment, and a break of the building symmetrical wedge formation can soon re-open the door to directional plays.
GBP/USD Four-Hour Price Chart

Chart prepared by James Stanley
USD/JPY: Yen-Weakness in the Spotlight Ahead of Japanese Inflation
Yen weakness has started to show again ahead of tonight’s release of July inflation numbers out of Japan. This, however, does not eliminate the messy state of affairs in USD/JPY, where directional biases remain a challenge. For USD/JPY, I want to see a test above 111.50 to re-open the door for bullish positions; until then, I’m on guard for Yen strength. But trading for Yen-strength may not be the most attractive way of going about the matter. Instead, I’m looking to a potentially weak Euro for that theme.
EUR/JPY Testing Fibonacci Resistance
We wrote about this setup yesterday, but the same Fibonacci support level that helped to open the door to bearish breakouts earlier in the month can now be repurposed for resistance. This is the price of 128.52, and while intra-day price action saw tests above, sellers have punched prices back-below. At this point, the Daily chart is indicating wick through resistance, which highlights that seller reaction, and that keeps the door open for short-side plays in the pair. In the webinar, we looked at a couple of ways to use short-term price action to time entry into the bearish move.
EUR/JPY Daily Price Chart: Non-Completed Spinning Top at Resistance
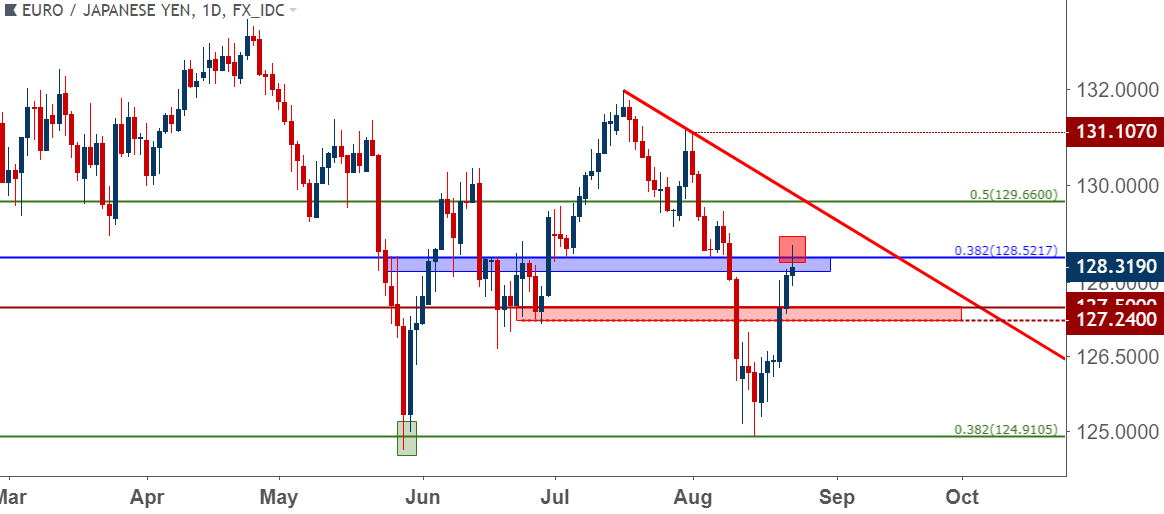
Chart prepared by James Stanley
GBP/JPY With Bullish Potential Up to 143.50-143.75 Resistance Zone
We contrasted that short-side setup in EUR/JPY with a bullish setup in GBP/JPY. The same resistance levels that we used last month to sell the pair down to 140.00 have now come back as short-term support. This is taking place around the 142.50 psychological level, and buyers have shown a tendency to defend that zone over the past couple of days. This keeps open the possibility of topside extension into a larger zone of relevance. This runs from the prior swing-high of 143.50 up to the Fibonacci level at 143.79, which was also a prior swing-low.
GBP/JPY Hourly Price Chart
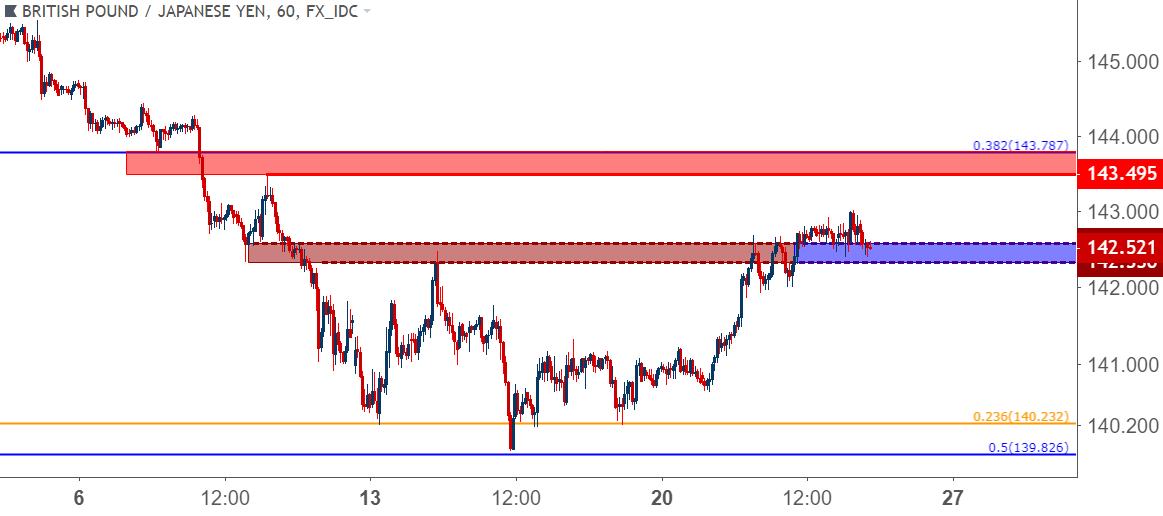
Chart prepared by James Stanley
AUD/USD Setting Up For a Re-Match at .7200
Last week we also looked for reversal plays in AUD/USD, largely driven by the long-term support zone at .7200. This is an area that had turned around two aggressively bearish moves in 2016 and since, hadn’t come back into play. Until last week, that is, and prices quickly built from support to jump up to a high of .7382.
But since USD support has begun to play, AUD/USD weakness has shown back with aggression. This is setting up for another re-test at .7200, and the way that price performs upon that re-test will tell us quite a bit about the next best steps. If we do see bears pull up short, allow for a higher-low, bullish positions can become attractive again. But – if we do test below support, the door re-opens for bearish continuation down to fresh lows.
AUD/USD Four-Hour Price Chart

Chart prepared by James Stanley
Dow Jones With Short-Term Topping Potential, Standing Back
We closed by looking at US equities. The Dow Jones Industrial Average surged up to a fresh six-month-high earlier this week. But bulls simply couldn’t hold the line, and prices started to pullback. Yesterday was similar, albeit without the fresh highs, but a second consecutive day of indecision led to the heightened possibility of pullbacks, particularly with Jackson Hole looming on the calendar for tomorrow.
In this morning’s article, we looked at a key place to look for that next iteration of support. This rests around the 14.4% Fibonacci retracement of the post-Election move, which is confluent with the 61.8% retracement of the February sell-off at 25,328.
Dow Jones Daily Price Chart: Topping Potential, Confluent Support Lurks Below

Chart prepared by James Stanley
To read more:
Are you looking for longer-term analysis on the U.S. Dollar? Our DailyFX Forecasts for Q1 have a section for each major currency, and we also offer a plethora of resources on USD-pairs such as EUR/USD, GBP/USD, USD/JPY, AUD/USD. Traders can also stay up with near-term positioning via our IG Client Sentiment Indicator.
Forex Trading Resources
DailyFX offers a plethora of tools, indicators and resources to help traders. For those looking for trading ideas, our IG Client Sentiment shows the positioning of retail traders with actual live trades and positions. Our trading guides bring our DailyFX Quarterly Forecasts and our Top Trading Opportunities; and our real-time news feed has intra-day interactions from the DailyFX team. And if you’re looking for real-time analysis, our DailyFX Webinars offer numerous sessions each week in which you can see how and why we’re looking at what we’re looking at.
If you’re looking for educational information, our New to FX guide is there to help new(er) traders while our Traits of Successful Traders research is built to help sharpen the skill set by focusing on risk and trade management.
--- Written by James Stanley, Strategist for DailyFX.com
Contact and follow James on Twitter: @JStanleyFX


